

Long waiting times are a problem. But long waiting times to diagnosis and decision are a bigger problem, because many urgent conditions (including many cancers) are only discovered when the patient reaches diagnosis. If the wait for diagnosis is long, those conditions will be more advanced when they are detected, and the prognosis for the patient will be worse.
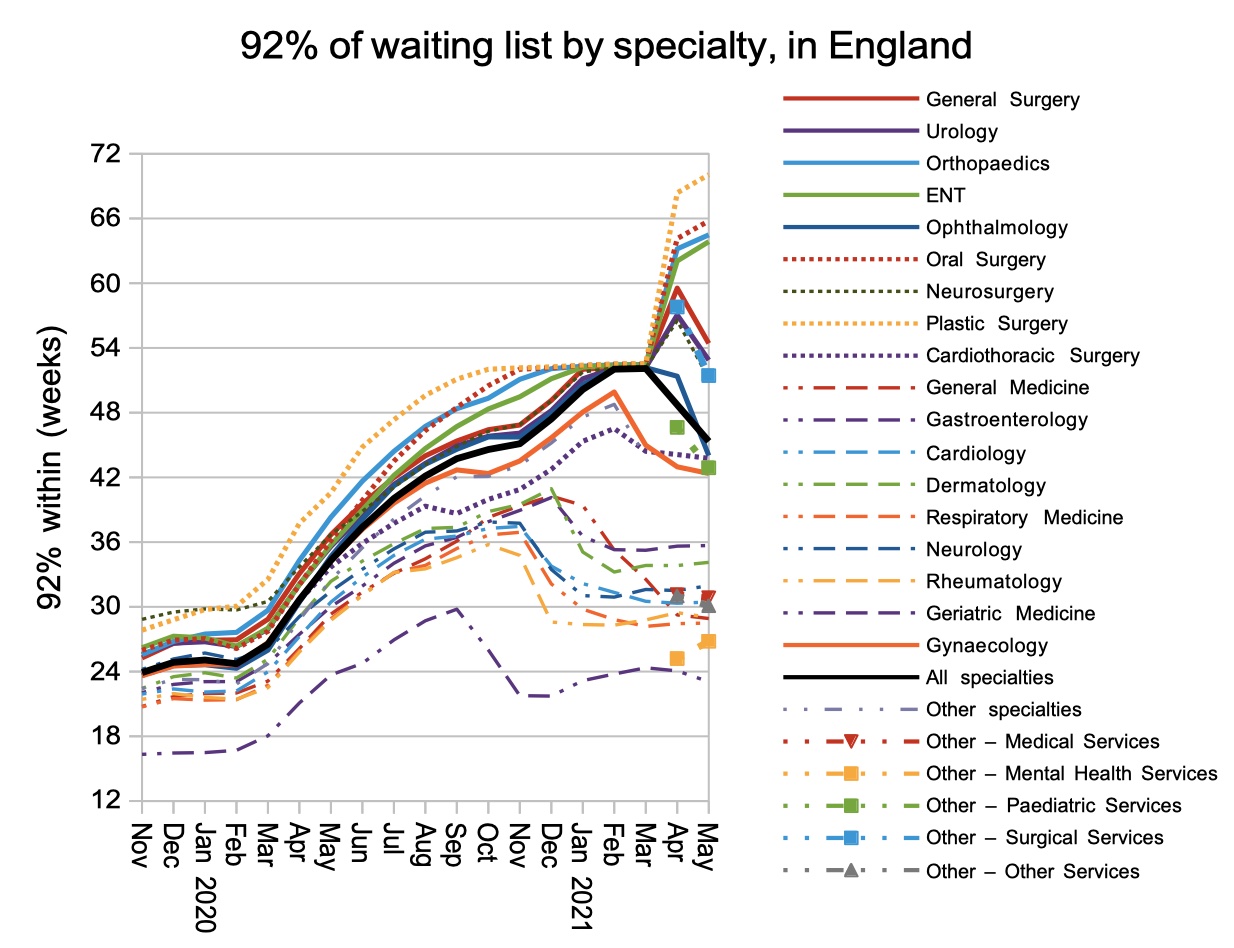
So it is a matter of grave concern that the waiting time, for patients who do not have a decision to admit (which is the closest proxy we have for patients without a diagnosis), is 37 weeks across all specialties.
In surgical specialties the waits can be even longer: in General Surgery it is 40 weeks; Urology 41 weeks; Orthopaedics 41 weeks; ENT 49 weeks; Ophthalmology 40 weeks; Plastic Surgery 44 weeks; Cardiothoracic 31 weeks; and Gynaecology 35 weeks.
Several of those specialties treat high volumes of cancer patients, and we know that nearly a quarter of cancers are referred NOT on a Two Week Wait pathway. So these figures suggest that large numbers of cancers are being detected late because referral-to-decision waiting times are so long. This is a serious clinical risk which needs to be addressed as a high priority – even higher than ultra long waiting times for routine admission.
In the following discussion, all figures come from NHS England and NHS Improvement. If you have a national statistic that you’d like to check up on, you can download our waiting times fact checker.
For analysis of waiting times performance at a particular organisation, visit our reports page, or our map of the latest RTT waiting times across England.
England-wide picture
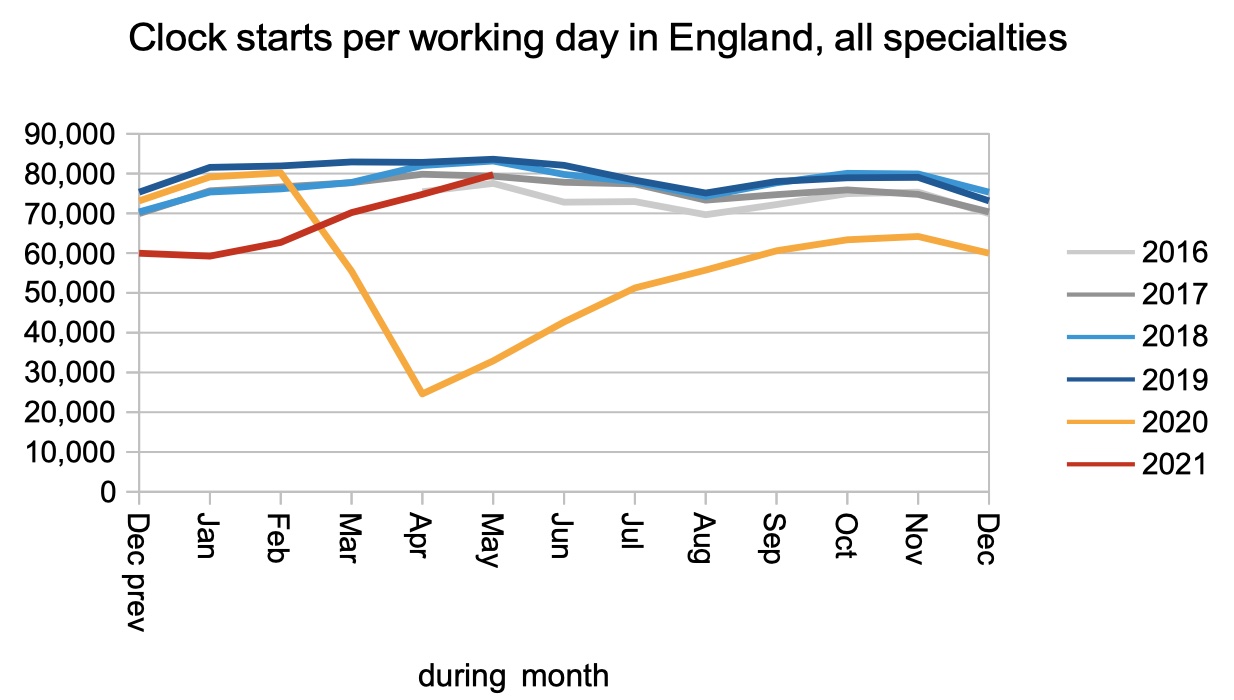
Referrals for consultant led care have finally climbed back to near pre-covid levels, as shown by the number of RTT clock starts. We can expect referrals to go even higher in the coming months, as patients who avoided the NHS during covid come back for the treatment they need. The number of missing referrals since covid began is over 7 million, and even if only one-third of those patients come back the numbers will be very significant.
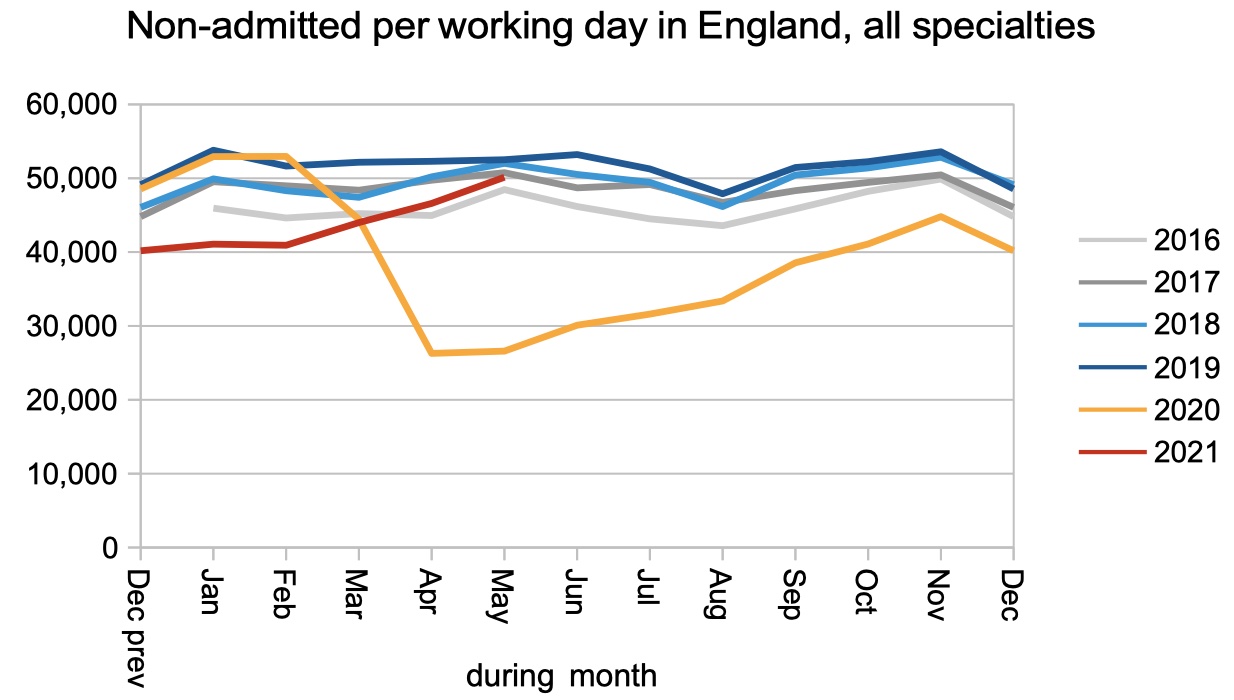
Clock stops for reasons other than admission, which we can use as a proxy for relative outpatient and diagnostic activity, also approached pre-covid levels in May.
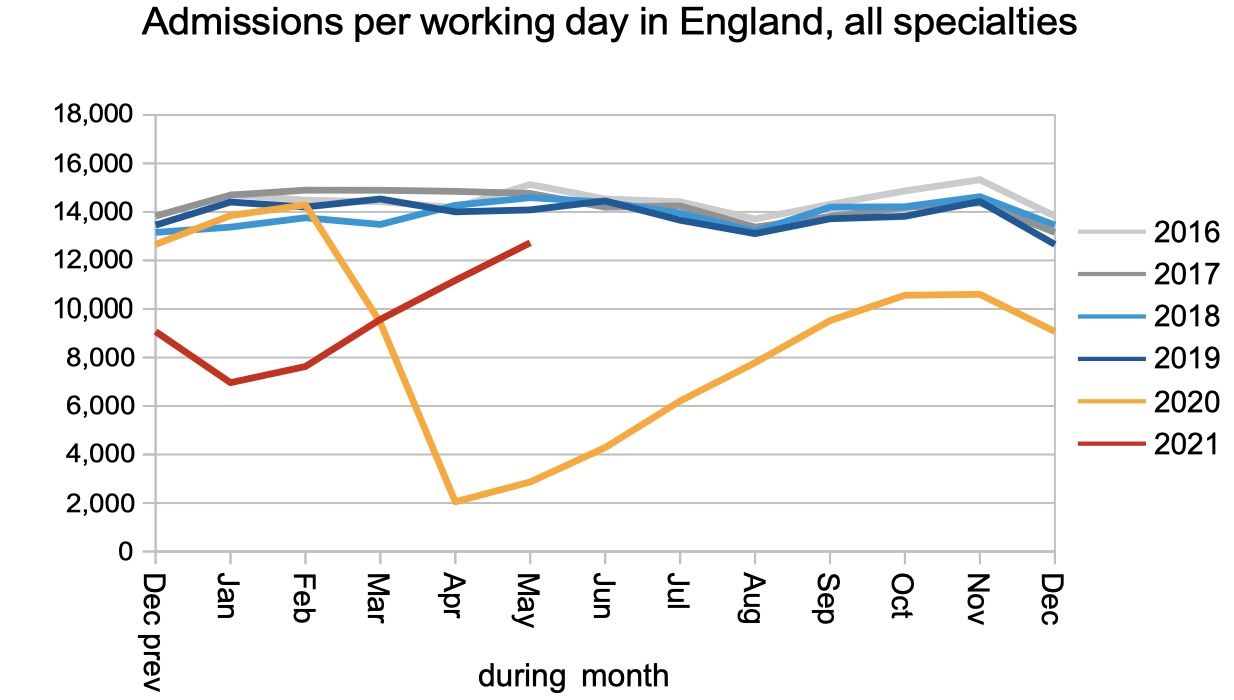
The admission rate is taking longer to recover, because these are patients who must physically come into hospital, and they are most affected by the continuing measures to prevent and control covid infections.
The net result is that the waiting list continued to grow rapidly. This growth can be expected to accelerate as the pent-up demand returns.
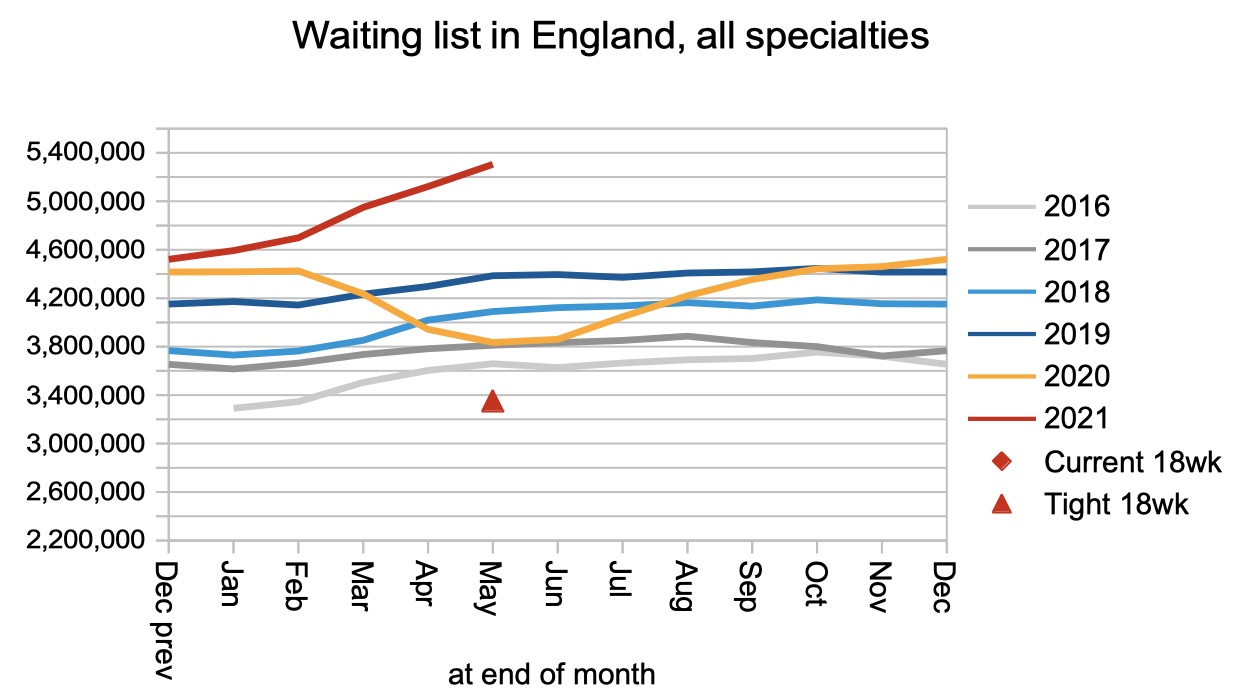
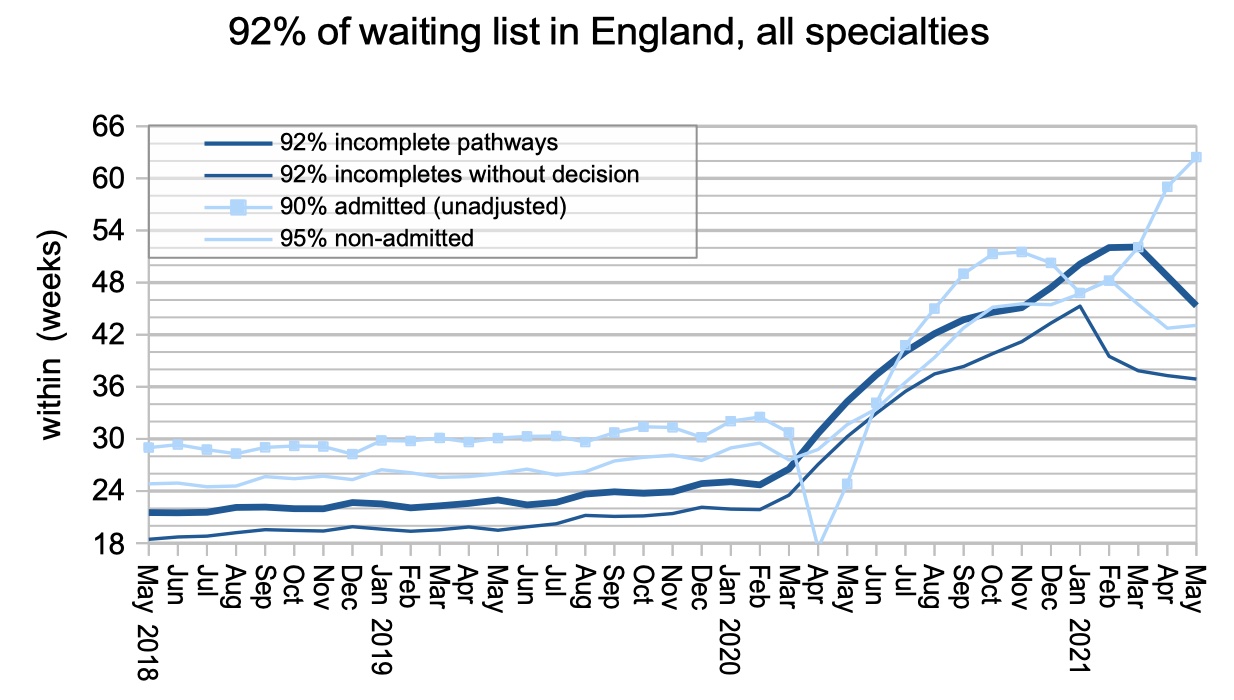
Even though the waiting list is growing, waiting times are shrinking. This apparent paradox is easily explained. The first covid shutdown started in March 2020 and lasted several months, and few patients were referred back then. This lull is reaching its anniversary at the moment, which means that few patients are tipping over the one-year-wait mark. This lull, combined with the recovery in routine elective activity, is causing rapid improvement in the longest waiting times. It won’t last; after the lull feeds through, a growing waiting list will inevitably translate into growing waiting times.
The chart below has a new line. For the first time, it splits out waiting times for patients without a decision to admit, which is the best proxy we have for patients without a diagnosis. Their waits have risen rapidly during covid, peaking at the end of January before falling to around 37 weeks at the end of May. Long waits to diagnosis mean long delays in detecting some urgent clinical conditions, and some of those patients may have developed advanced disease that is difficult or impossible to treat.
Acute trusts can monitor this risk more directly by tracking the number of routine outpatients who convert to urgent admissions or are given cancer diagnoses. If your hospital is detecting significant numbers of such patients, then you can be sure there are more yet to be detected on the waiting list.
The number of one year waiters usually catches a lot of media attention, but as noted above this is largely an artefact of the lull in referrals one year previously. The growing waiting list tells the true story.
If you are wondering how many two year waiters there were at the end of May, it was 3,927 patients.

Waiting times are exceptionally long in some surgical specialties, and as we saw above these specialties also have long waits to diagnosis and decision to admit.
Local detail
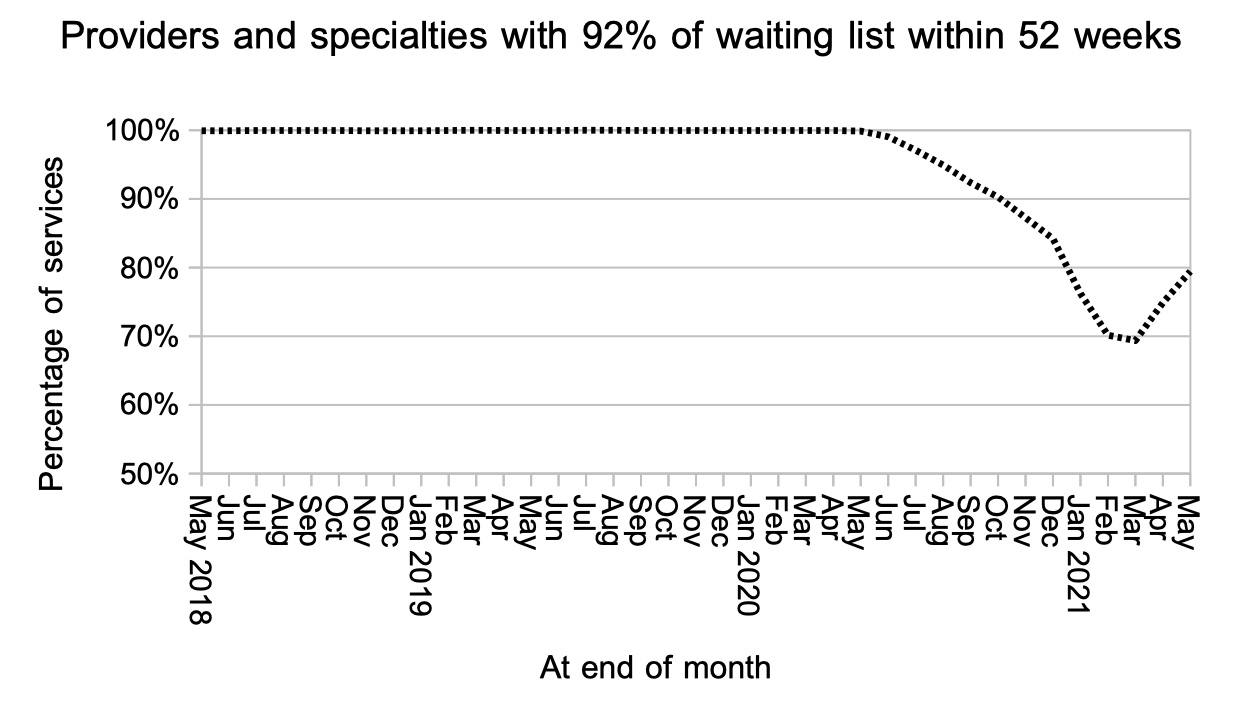
In line with the overall picture on one year waiters, the proportion of local specialties with waiting times below a year improved for the second month running.
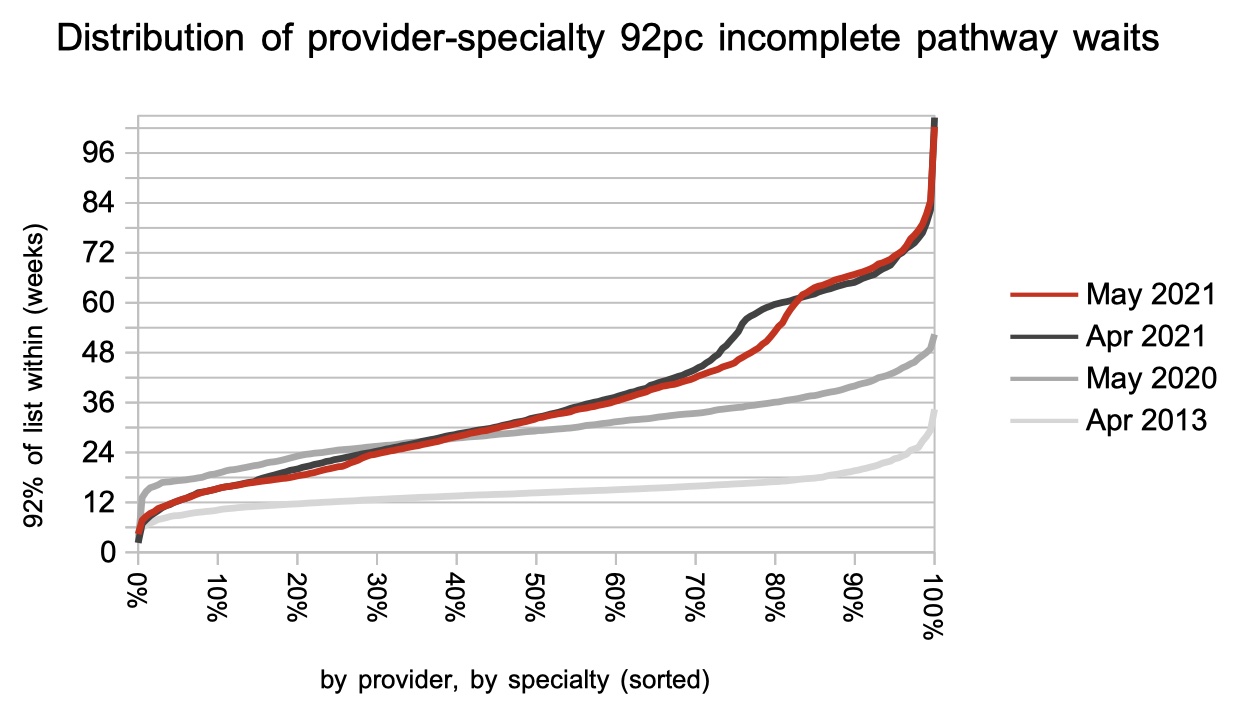
Finally, here is the distribution of waiting times, by provider by specialty. This chart really benefits from the new RTT data which goes up to 104 weeks instead of the previous 52 weeks.
Referral-to-treatment data for June is due out at 9:30am on Thursday 12th August 2021.