

The waiting list has hovered just below six million, as more patients were discharged or removed from the waiting list.
Analysis produced for Health Service Journal by Dr Rob Findlay, Director of Strategic Solutions at Insource Ltd and founder of Gooroo Ltd
The referral-to-treatment (RTT) waiting list has been growing fairly rapidly since February 2021, but this growth came almost to a halt in November, according to the latest figures for England. The waiting list remained just below six million and was once again the largest since RTT records began in 2007.
The cause? A rise in ‘non-admitted clock stops’, in RTT jargon. As the name suggests, this refers to patients whose wait comes to an end for any reason other than admission to hospital as an inpatient or day-case.
Non-admitted clock stops are mostly a mix of two things: patients who are seen in clinic by a specialist and discharged; and patients who are deleted from the waiting list because their elective pathway records have been checked and they were on the waiting list in error (a process called ‘validation’). Both are incentivised in the planning guidance, and unfortunately, we cannot tell from the data which caused the increase in clock stops.
If the size of the waiting list remained constant in November, what about the shape? This continued to improve, with the net result that RTT waiting times improved slightly too, although in absolute terms both are still dreadful.
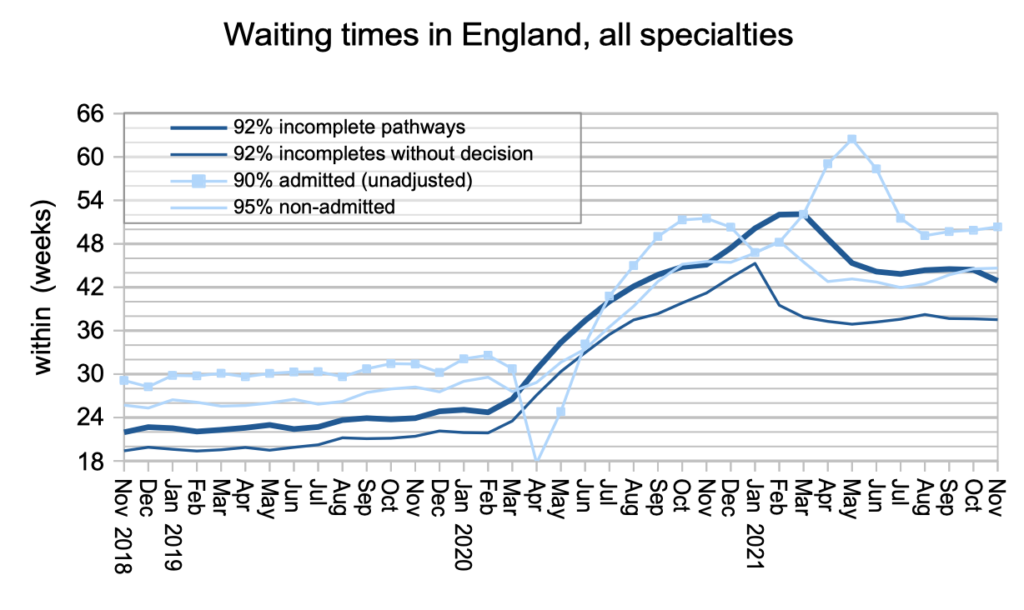
At the end of November, 92 per cent of the RTT waiting list was waiting up to 42.9 weeks. Within that list, patients who had still not received a diagnosis and decision to admit were waiting up to 37.5 weeks. These long waiting times for diagnosis and decision are very concerning, because significant numbers of urgent conditions are only detected at this point, including nearly a quarter of all cancers. [Referral to treatment waiting time targets have reached the end of the road.]
In the following discussion, all figures come from NHS England. [NHS England RTT Waiting times fact checker] If you have a national statistic that you’d like to check up on, you can download our waiting times fact checker. [RTT Waiting times fact checker.xls]
The numbers
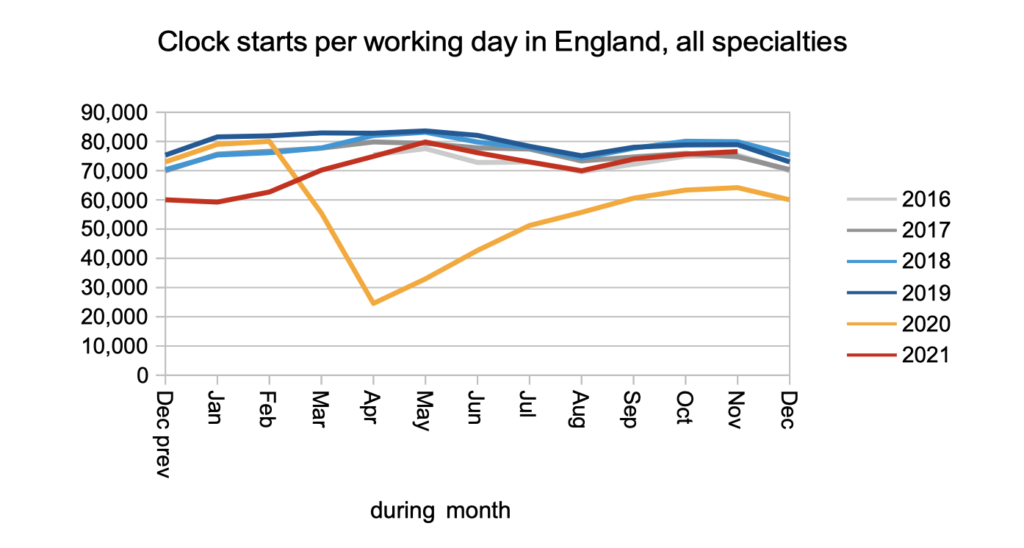
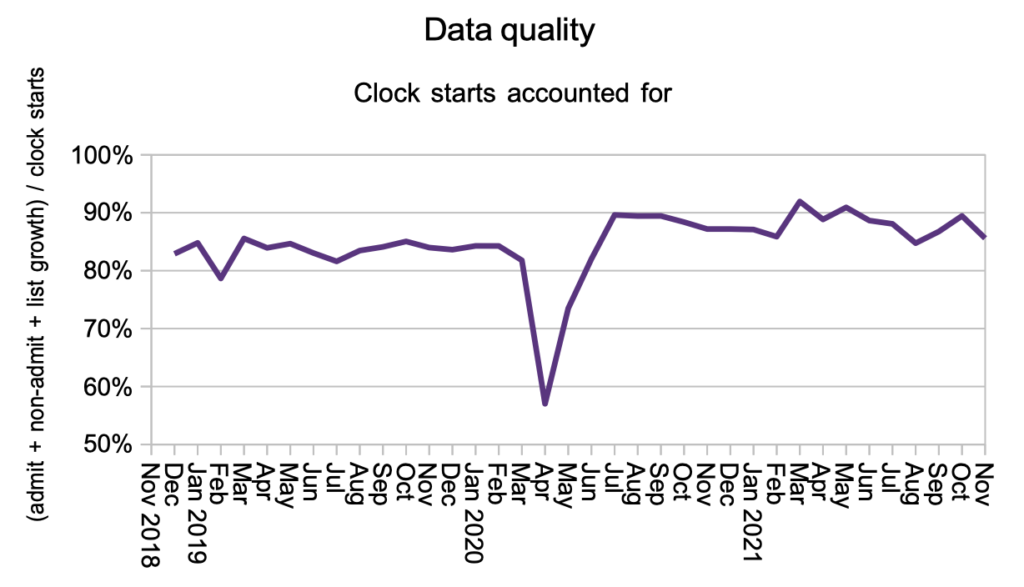
Why did waiting list growth suddenly stop in November? It wasn’t a fall in clock starts – patients joining the waiting list – as the chart below shows.
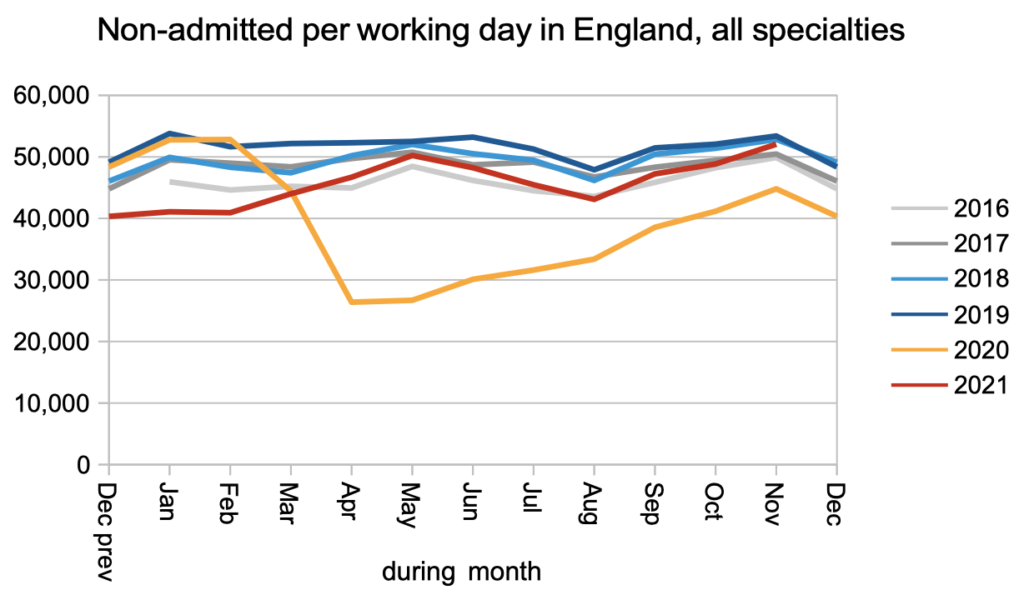
In fact, it was an increase in non-admitted clock stops; patients who were removed from the waiting list without being admitted as an inpatient or day-case. Most are removed either because they have been discharged from clinic, or because they were found to be on the list in error. An increase in this measure was expected because clock stops are currently incentivised in the planning guidance, and non-admitted clock stops are a lot easier to deliver than admitting patients to hospital.
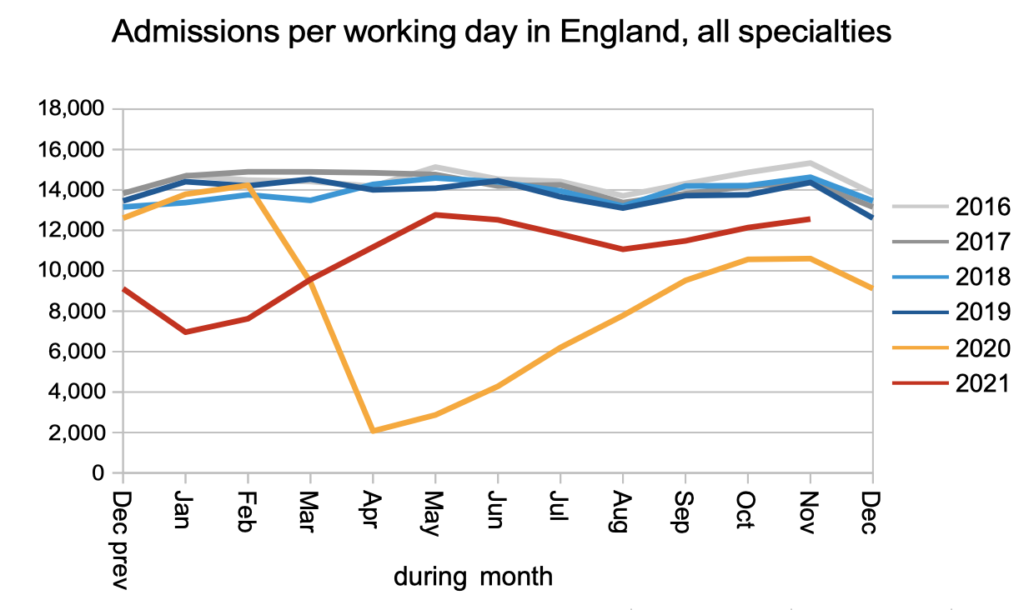
Inpatient and day-case admissions to hospital continued to track well below the pre-covid years, following the pattern since May 2021.
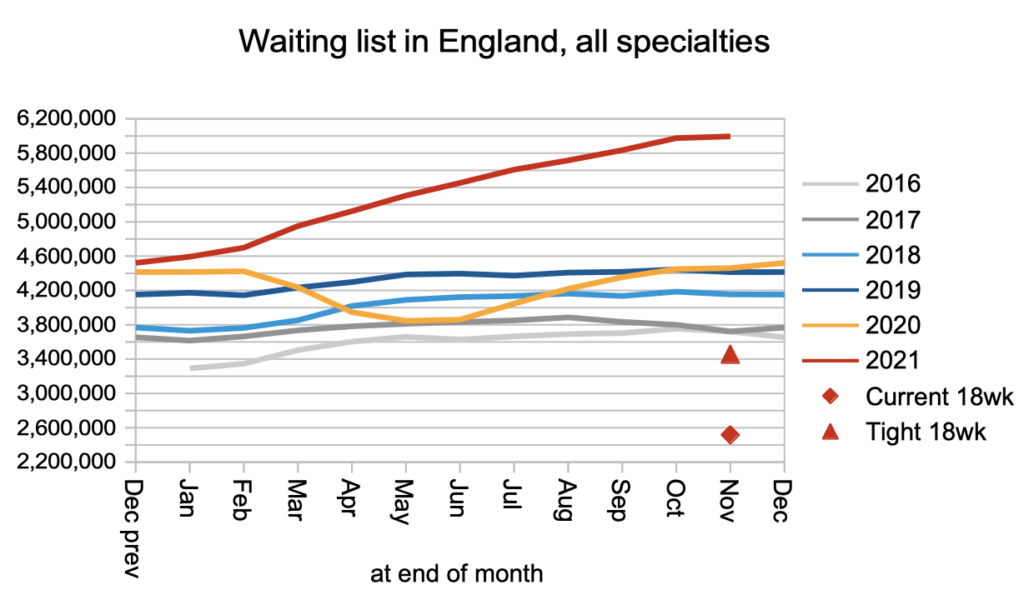
So overall, non-admitted clock stops went up, and everything else remained pretty constant, with the net result that growth in the waiting list almost stopped. The recorded waiting list size at the end of November was 5,995,156 open patient pathways. In the chart below, the red triangle shows that the waiting list would need to fall to around 3.5 million before an 18 week RTT wait could be achieved again across England.
The purpose of the next chart is to check whether more patients are being removed from the waiting list without being recorded as non-admitted clock stops, and we can see that there has been no significant change in this indicator.
Waiting times to diagnosis and decision to admit remained roughly steady at 37.5 weeks, while RTT waiting times fell slightly from 44.4 to 42.9 weeks.
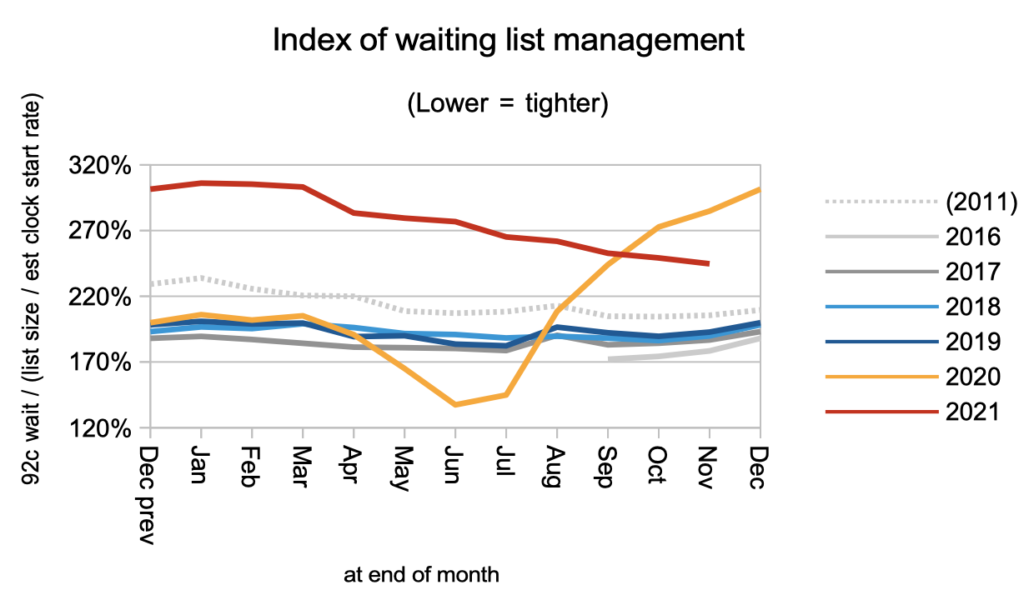
Waiting times are a function of both the size and shape of the waiting list. We have already seen that the size remained steady, and the chart below confirms that the fall in waiting times was caused by an improvement in the shape.
At specialty level, Plastic Surgery has the longest waiting times, followed by most of the surgical specialties. Medical specialties are largely clinic-based with a high proportion of clinical priority patients, and although their waiting times look good compared with surgery they remain far too long in absolute terms.
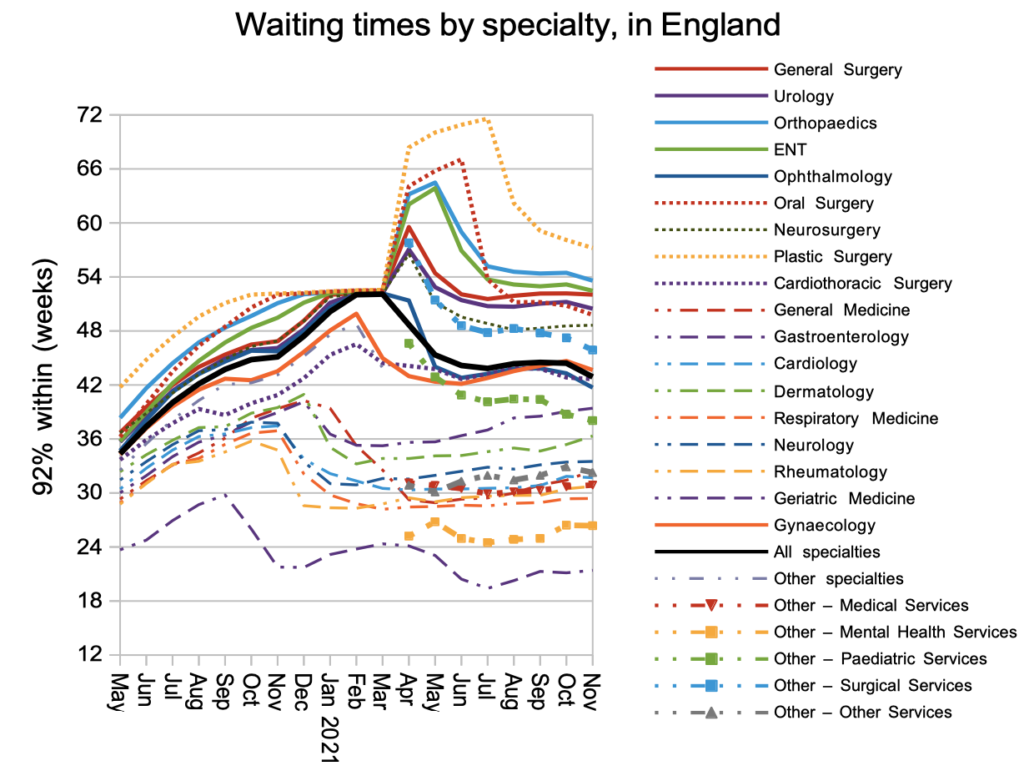
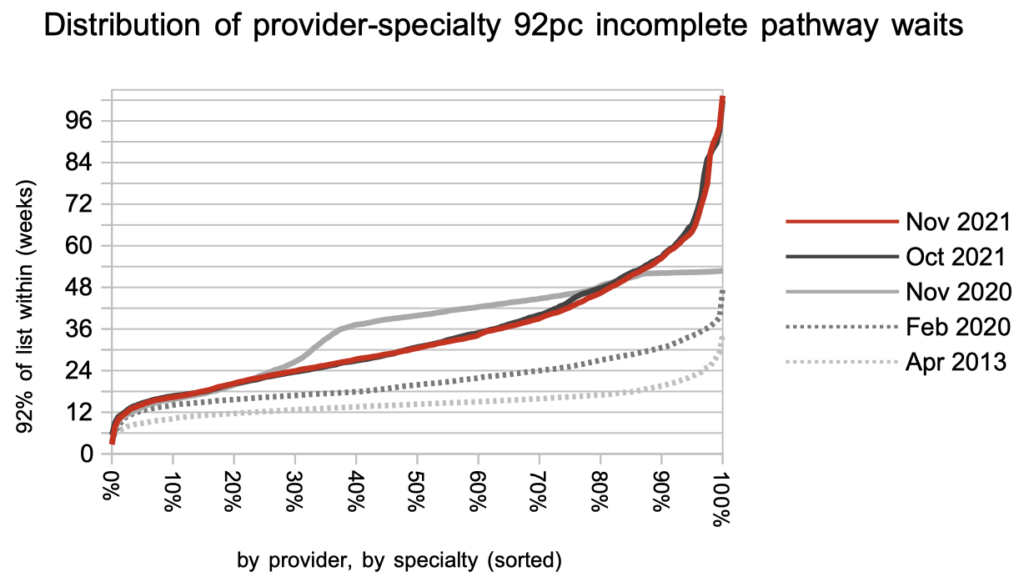
Looking at each of the thousands of local specialties within providers, the distribution of waiting times is little changed since the previous month. (Don’t be misled by the apparently much better long-wait position in November 2020: before April 2021 there was no breakdown of waiting times over 52 weeks, which is why the line stops at that level.)
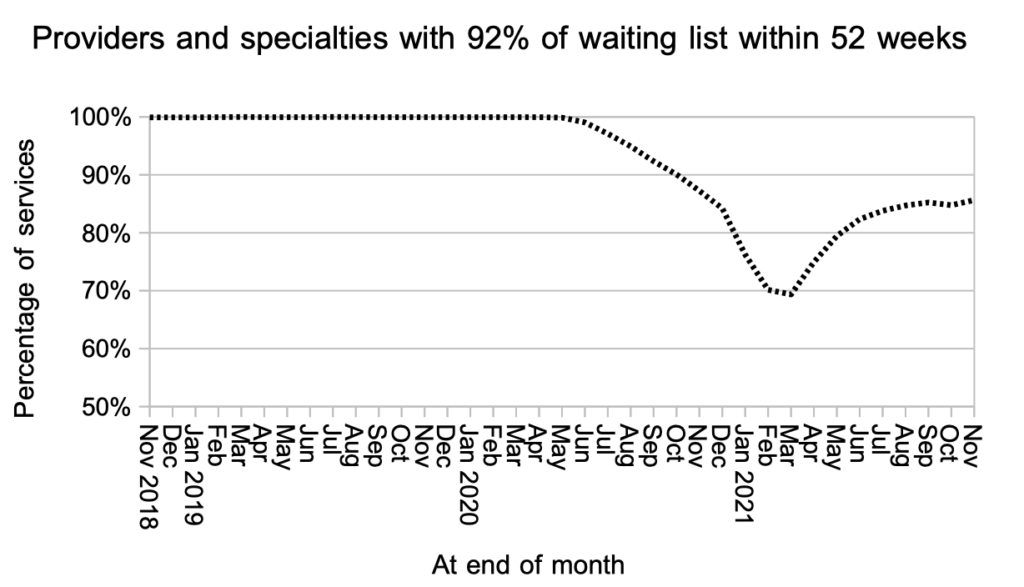
The proportion of local specialties achieving a 52-week wait did not change much in November. The number of patients waiting over 104 weeks across England increased from 16,225 to 18,585.
Referral-to-treatment data up to the end of December 2021 is due out [NHS England 12 months statistics calendar] at 9:30am on Thursday 10th February.