

The number of 104-week waiters improved, but overall things are getting worse with elective waits.
Analysis produced for Health Service Journal by Dr Rob Findlay, Director of Strategic Solutions at Insource Ltd and founder of Gooroo Ltd
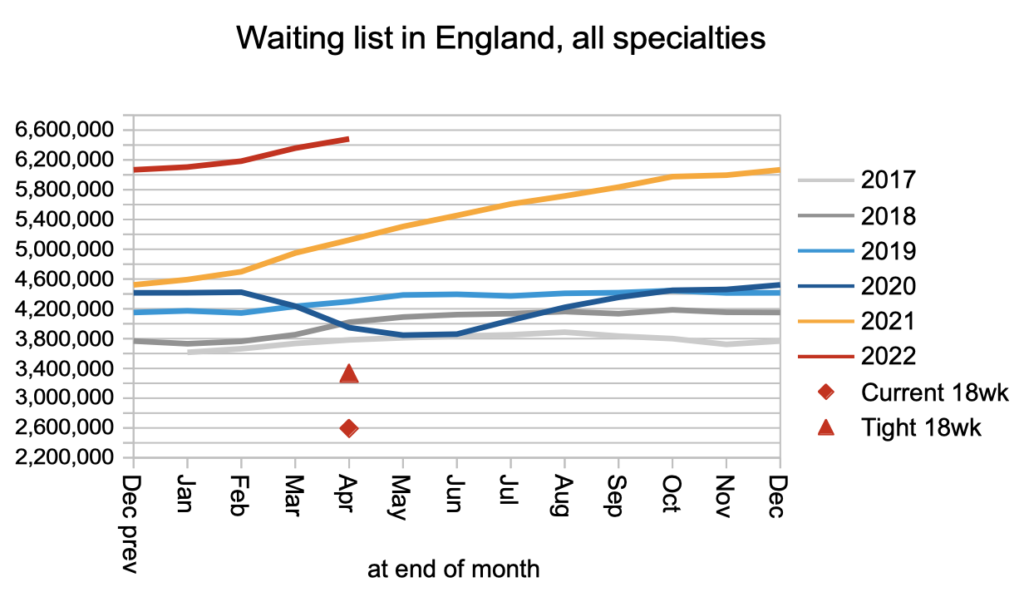
Waiting times to diagnosis and decision lengthened from 40.3 to 41.4 weeks in April. The overall referral to treatment (RTT) waiting time lengthened from 44.3 to 45.0 weeks, well above the statutory target of 18 weeks. And the waiting list grew from 6.36 million to 6.53 million, a new record. So overall, elective waits are still getting worse in England.
On the other hand, the number of patients who are waiting more than 104 weeks RTT fell from 16,800 to 12,700, which is progress towards the target of near zero before July. That is an improvement, and an important one, because it is risky and unfair to keep some patients waiting excessively while most are treated ahead of them.
How should we evaluate this mix of good and bad news?
The most important principle of waiting list management is that clinical priority patients should be seen and treated quickly. That includes undiagnosed patients whose clinical priority has not yet been determined, but who turn out on diagnosis to need urgent treatment. Performance is bad and getting worse on this measure, because of the very long waits from referral to diagnosis and decision, which are revealed in this analysis but remain invisible in the officially published data. The Welsh health service is moving to fix this problem by splitting the RTT target [NHS Wales transforming and modernising planned care], and NHS England should consider doing the same – see recent Gooroo blog – RTT end of the road.
The second most important principle is that no patient should wait very long for the care that has been promised to them. Performance is generally bad and getting worse on this measure too, as the long and growing overall waiting times show, although there is a silver lining in the falling number of 104-week waiters.
The third principle is that patients with similar clinical priority should broadly speaking be seen and treated on a first come, first served basis, and therefore experience similar waiting times. Performance is bad but getting better on this measure, as both the reduction in 104-week waiters and the slowly improving overall shape of the waiting list shows.
To sum up, one thing is getting better, while more important things are getting worse. Overall we must therefore conclude that things are getting worse.
In the following discussion, all figures come from NHS England. If you have a national statistic that you’d like to check up on, you can download our waiting times fact checker.xls.
The numbers
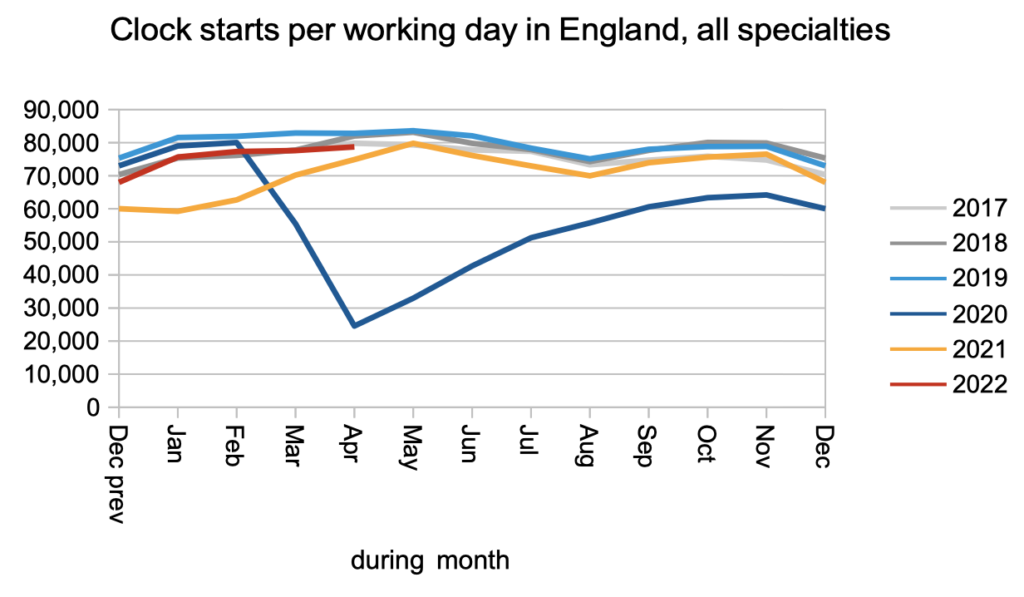
In April, patients were added to the waiting list (clock starts, in the jargon) at just below pre-pandemic rates, which has been the pattern since May last year.
There is still no sign of the millions of missing referrals from 2020 flooding back, and it is looking increasingly likely that there will be no flood but instead the thresholds at which patients seek care may have changed for the long term.
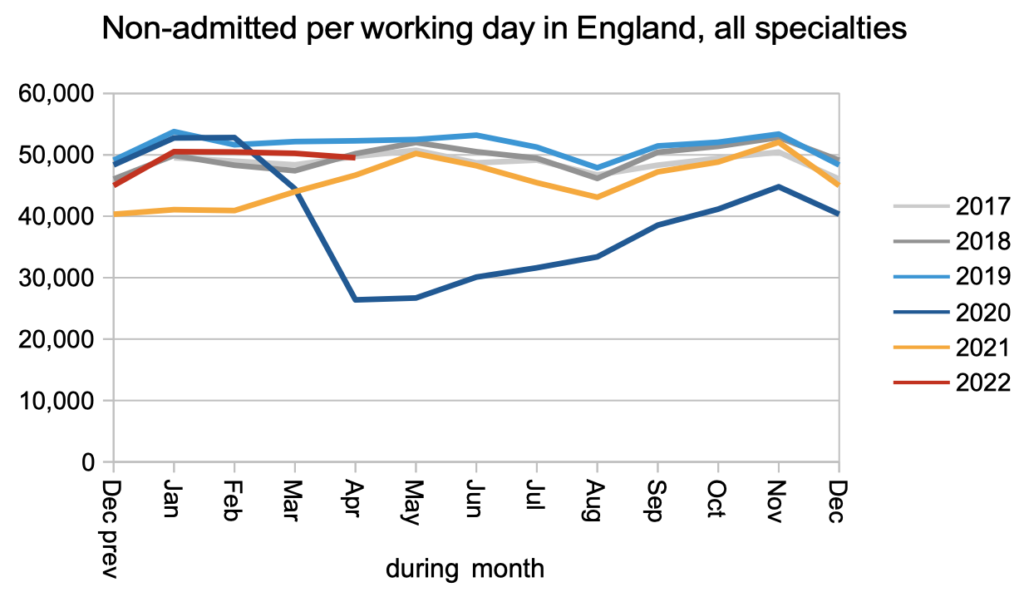
The rate of non-admitted clock stops (patients discharged from clinic, or whose wait otherwise ended without an admission to hospital) also remained just below pre-pandemic rates, as they have since May last year.
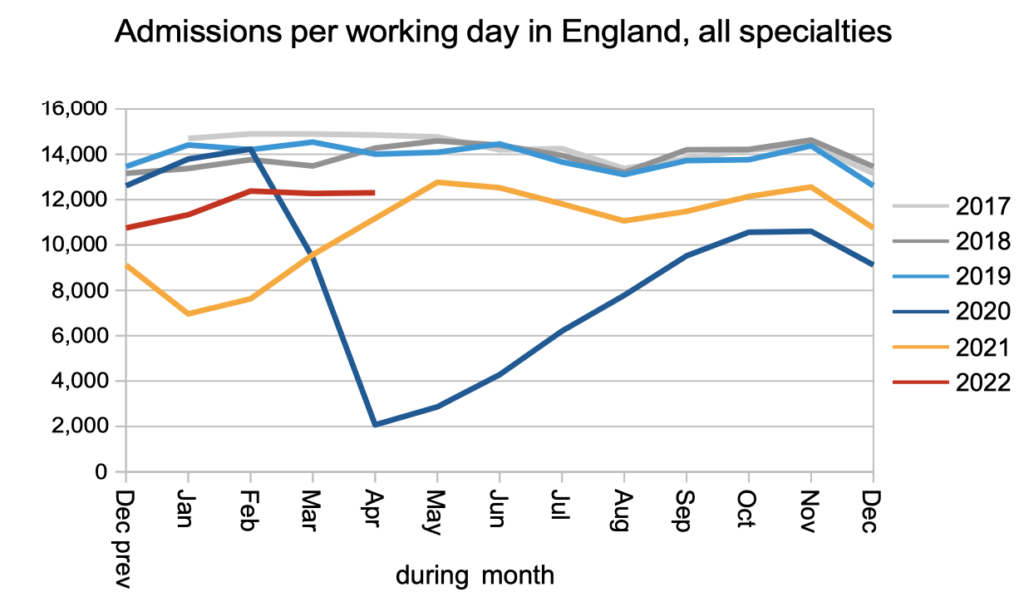
We might have hoped that the relaxation of covid infection prevention and control measures in April would have allowed an increase in admissions for inpatient and daycase treatment, but there is no sign of that happening just yet. Admissions to hospital remained significantly below pre-pandemic levels.
The net result of near pre-pandemic demand (i.e. clock starts) and below pre-pandemic activity (i.e. admitted and non-admitted clock stops) is a rapidly growing waiting list.
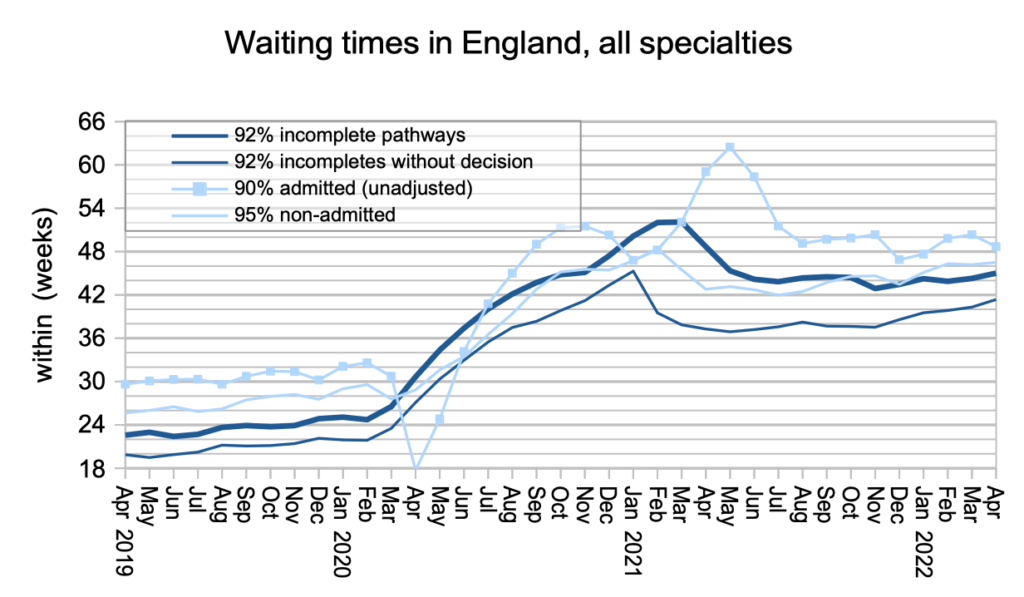
Waiting times went up, on an RTT basis.
More worryingly, waiting times from referral to diagnosis and decision also went up (‘incompletes without decision’, in the chart below). Why is this so worrying? The most common route to cancer diagnosis begins with a referral on the Two Week Wait (TWW) cancer pathway, which (as the name suggests) is subject to the short cancer waiting time targets. But the next most common route, for nearly a quarter of all cancers, is an ordinary GP referral which is not protected by the cancer waiting time targets because cancer is not yet suspected. Those patients are now typically waiting a very long time for their diagnosis, during which their cancer will have progressed. This is why reducing the waiting time to diagnosis and decision should take priority over reducing waiting times for patients who have already received a ‘routine’ diagnosis.
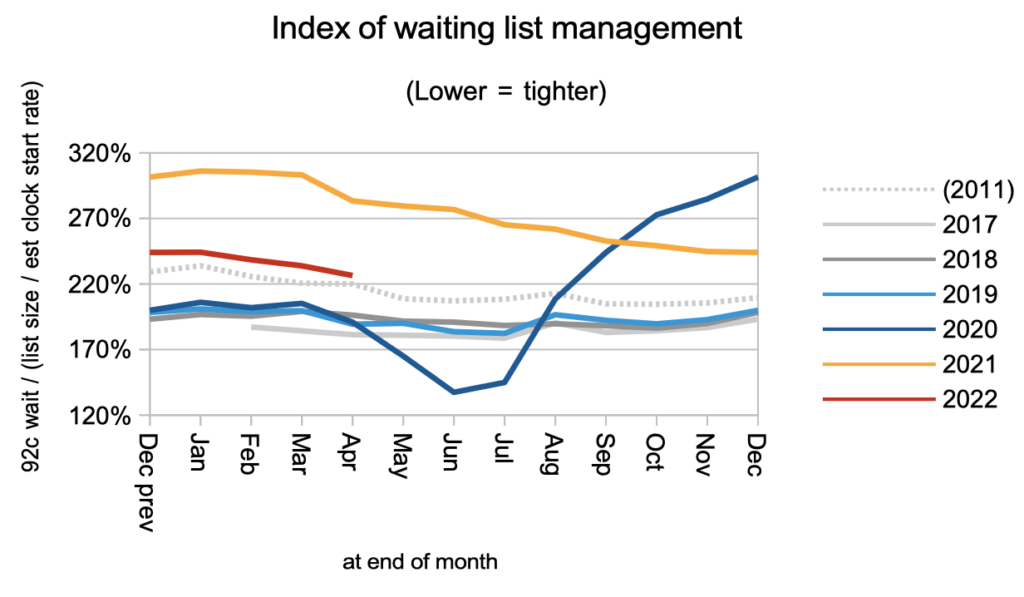
Waiting times are a function of both the size and shape of the waiting list. We saw above that the size grew. We can see below that the shape (summed up here by an index) improved slightly.
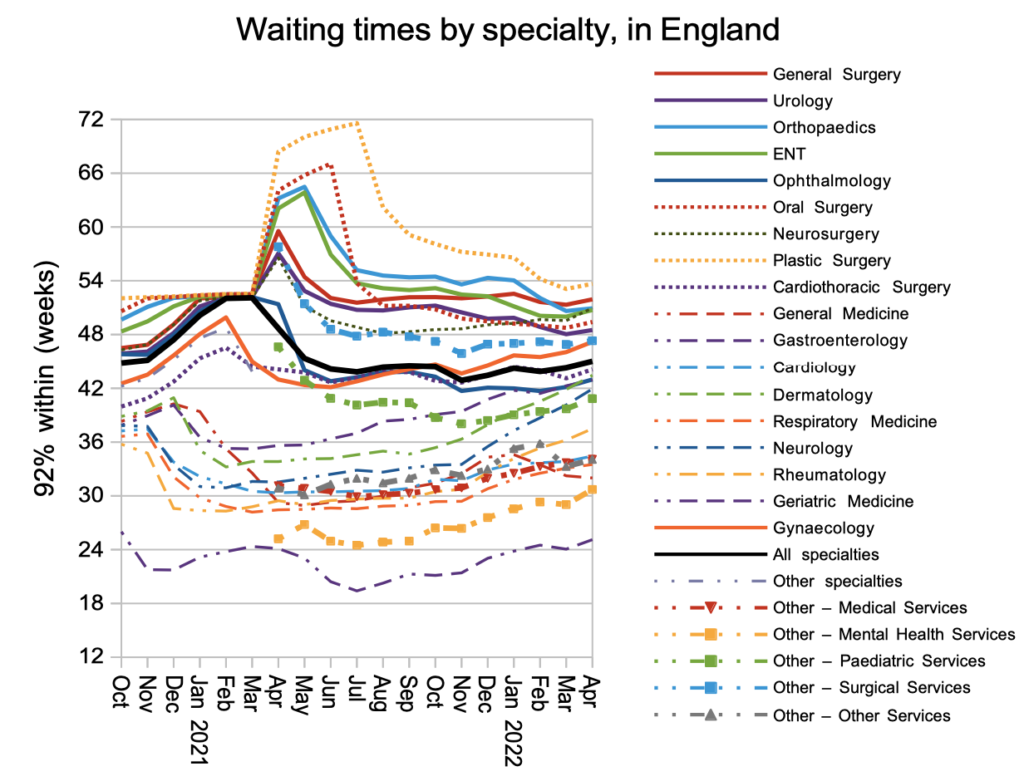
Lengthening waiting times were seen in nearly every specialty.
Looking in detail at the thousands of local specialties within hospital trusts, the deteriorating waiting times were experienced across the board.
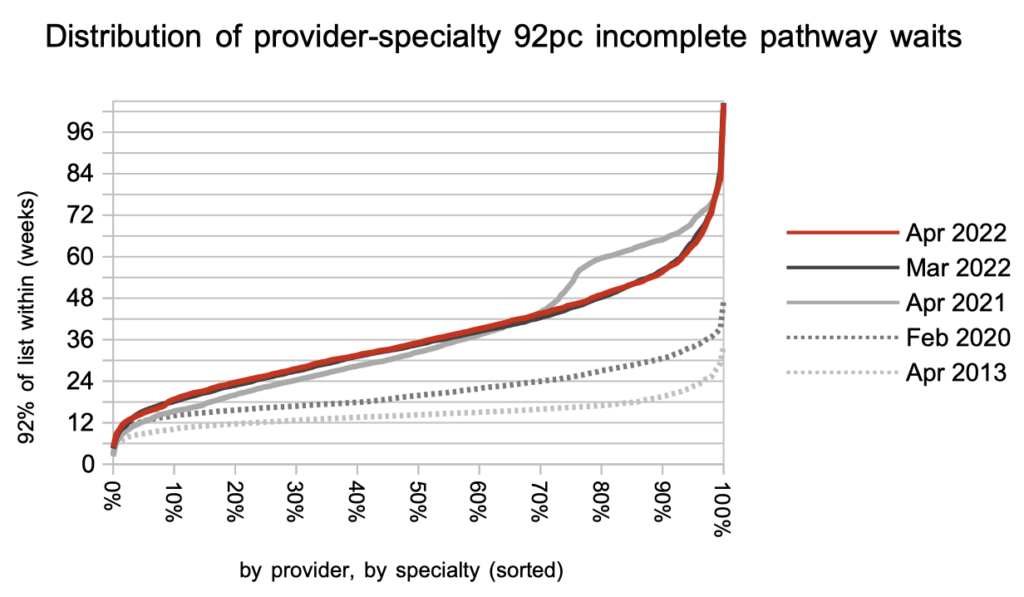
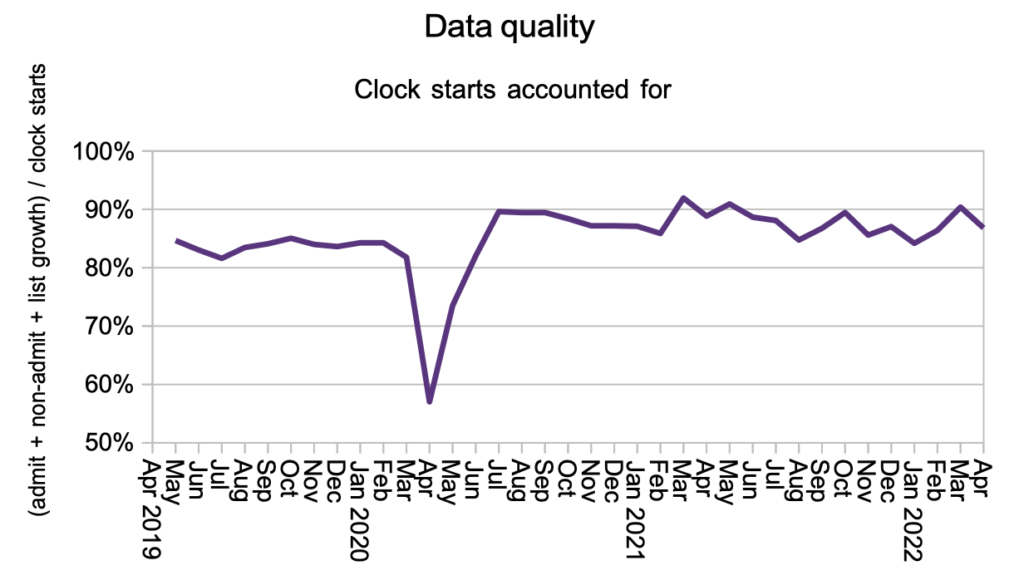
Our final chart is your occasional reminder that the data we all rely on is pretty poor; England-wide, over one in ten referrals disappear unexplained from the data. At local level the picture is even worse, with some local services seeing huge numbers of patients either appearing into or disappearing from the data.
The practical consequence of poor data is that hospitals don’t always know what patients need next, and some get lost in the system which is a patient safety risk. But hospitals risk being punished if they improve their data quality and discover long-waiting patients in the process, a perverse incentive that should be resolved – see our recent blog – Time for an amnesty on waiting list data.
Referral-to-treatment data up to the end of May is due out [NHS 12 months Statistics Calendar] at 9:30am on Thursday 14th July 2022.