

Growing underlying pressures are coming into conflict with the headline targets
Analysis produced for Health Service Journal by Dr Rob Findlay, Director of Strategic Solutions at Insource Ltd and founder of Gooroo Ltd
While attention turned towards the improvement in 104 week waiters during June (down from 8,028 to 3,861 patients), the underlying pressures on waiting times continued to worsen in the English NHS.
The size of the referral-to-treatment waiting list grew by 120,000 to 6.8 million patient pathways (including estimates for non-reporting trusts), and on current trends will breach the 7 million mark during August.
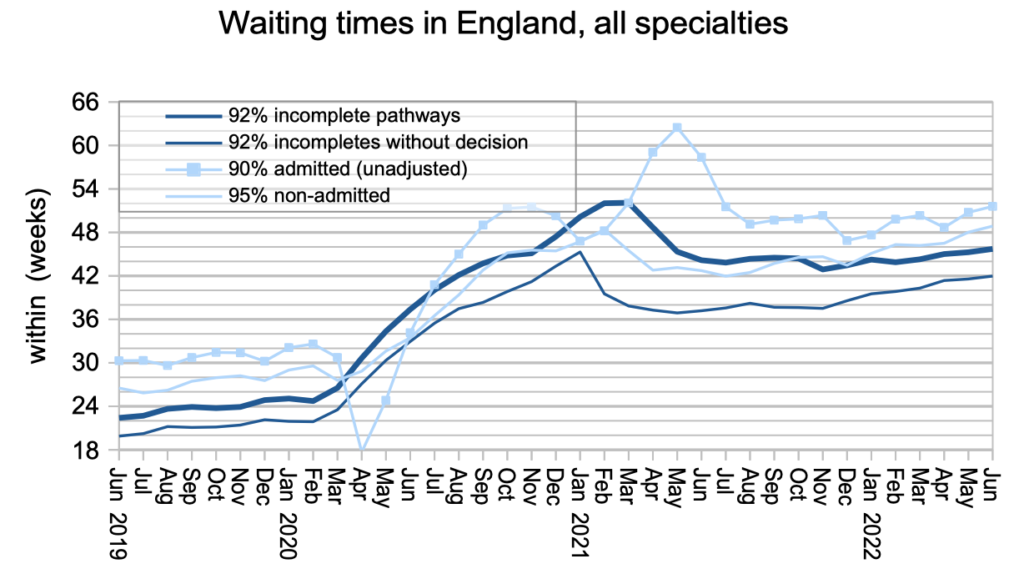
Waiting times grew too – the routine wait from referral to treatment rose to 45.7 weeks at the end of June, far worse than the statutory target of 18 weeks. The wait was 42.0 weeks for those patients who have not yet reached diagnosis and decision, which is too long for those with undiagnosed urgent conditions.
In some local services the underlying pressures are already coming into conflict with operational targets to reduce the very longest waiting times. In practical terms this means that managers are having to choose between booking delayed clinical priority and follow-up patients or, keeping those patients waiting despite the clinical risk so that they can treat routine patients who would otherwise breach the target. To the outside world the delayed clinical priorities and follow-ups are invisible, whereas the target breaches are public and heavily performance managed from the top of the system, hence the dilemma.
As the targets tighten and the underlying pressures continue to grow, more and more local services will face this dilemma. It would help local managers to do the right thing in these situations if delayed clinical priorities and follow-ups were openly monitored and protected alongside progress towards the operational targets. A real solution would of course remove the dilemma by addressing the root causes of long waits in every local service, by keeping up with demand, and booking all patients safely and fairly.
In the following discussion, all figures come from NHS England. If you have a national statistic that you’d like to check up on, you can download our waiting times fact checker. For analysis of waiting times performance at a particular organisation, visit our reports page or our map of the latest elective waiting times across England.
The numbers
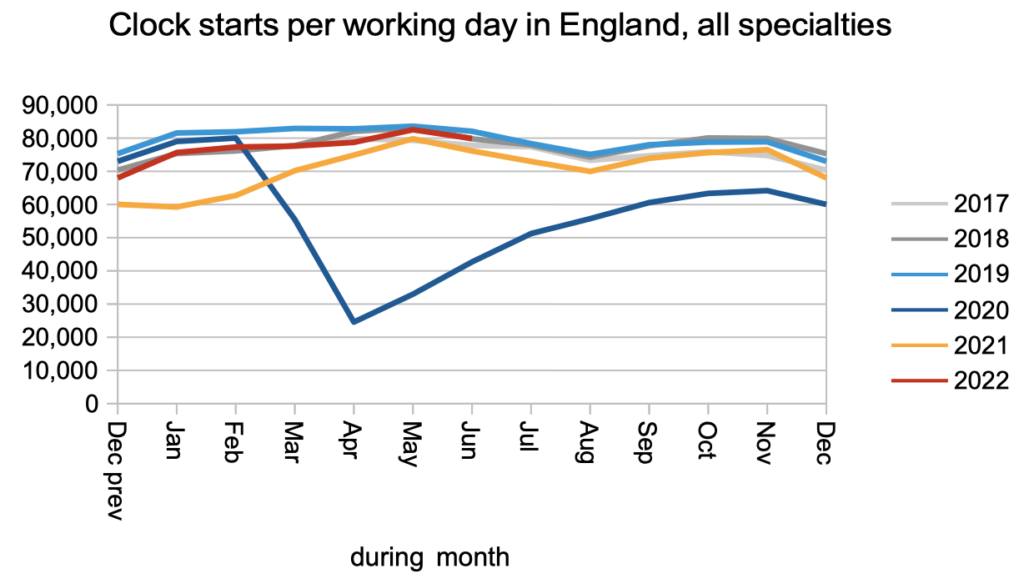
June was very similar to May. Patients started new waiting time ‘clocks’ at around pre-pandemic rates.
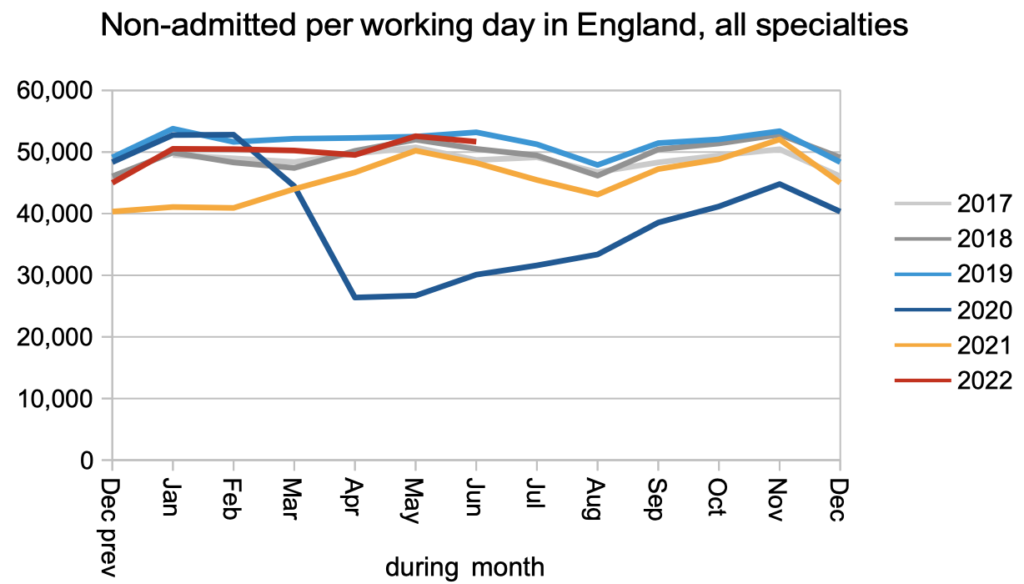
Patients were also treated or discharged from the waiting list, for reasons other than being admitted for treatment, at around pre-pandemic rates.
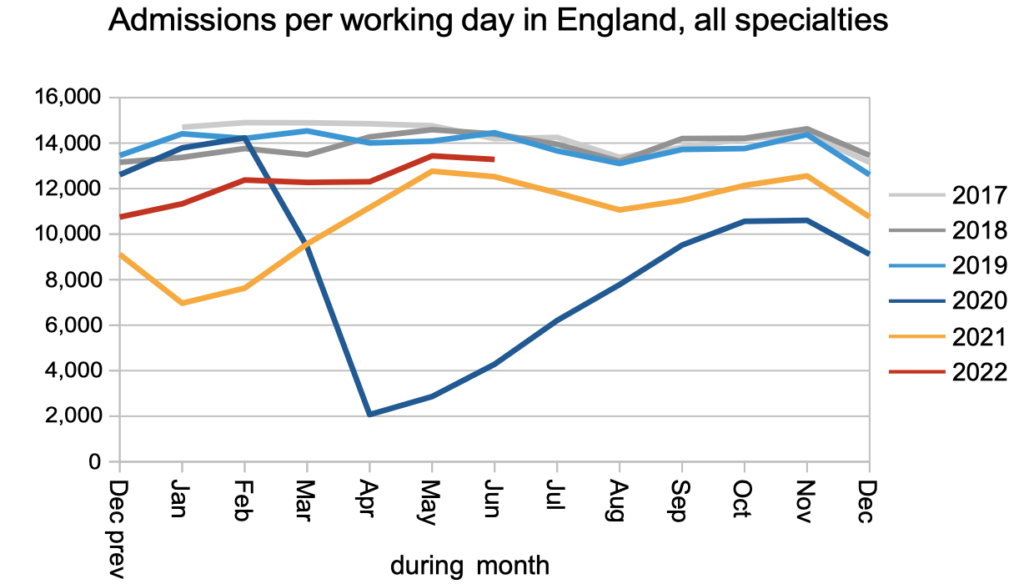
Patients were admitted for inpatient and daycase treatment at below pre-pandemic rates, although the gap has narrowed in recent months.
The net result of demand having recovered to near pre-pandemic levels, but admissions still falling short, is that the waiting list is continuing to grow rapidly.
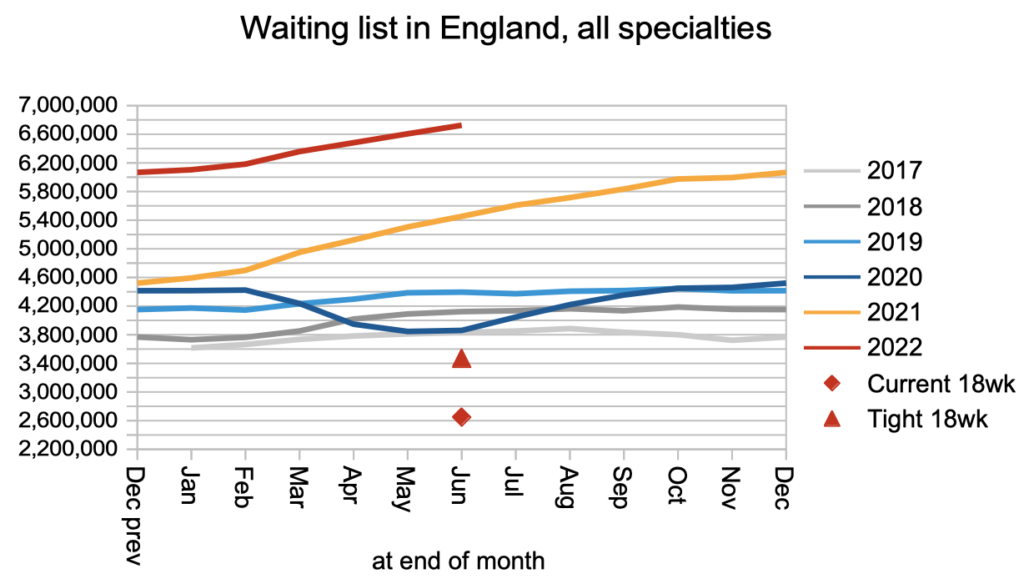
If the waiting list is growing rapidly then the underlying pressure on waiting times is growing too. Waiting times duly increased, both from referral to treatment, and for those patients who have not yet reached diagnosis and a decision to admit.
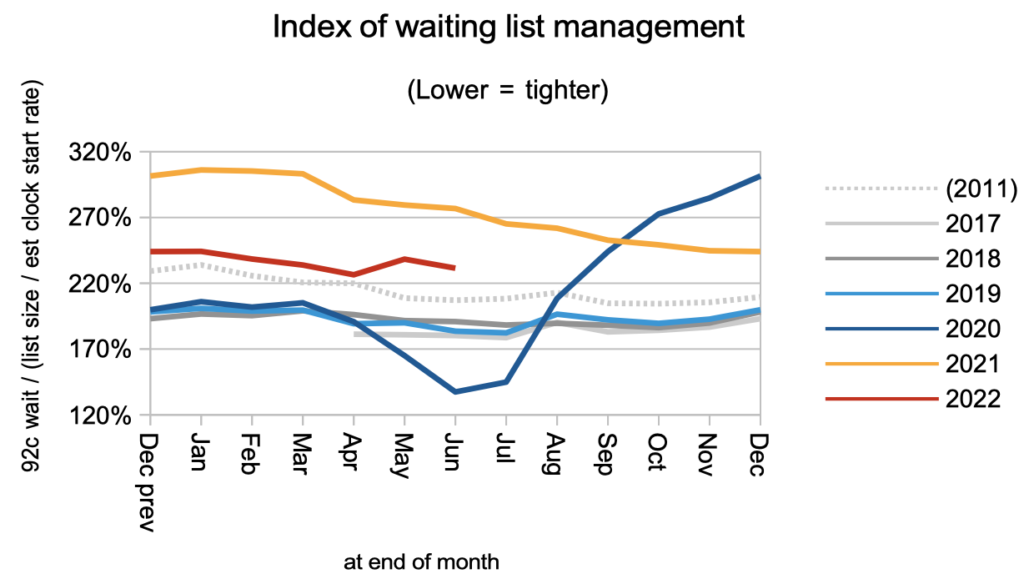
Waiting times are a function of both the size and shape of the waiting list. The index of waiting list management shows that the shape is worse than in 2011, when waiting list management was still being distorted by the older perverse waiting time targets.
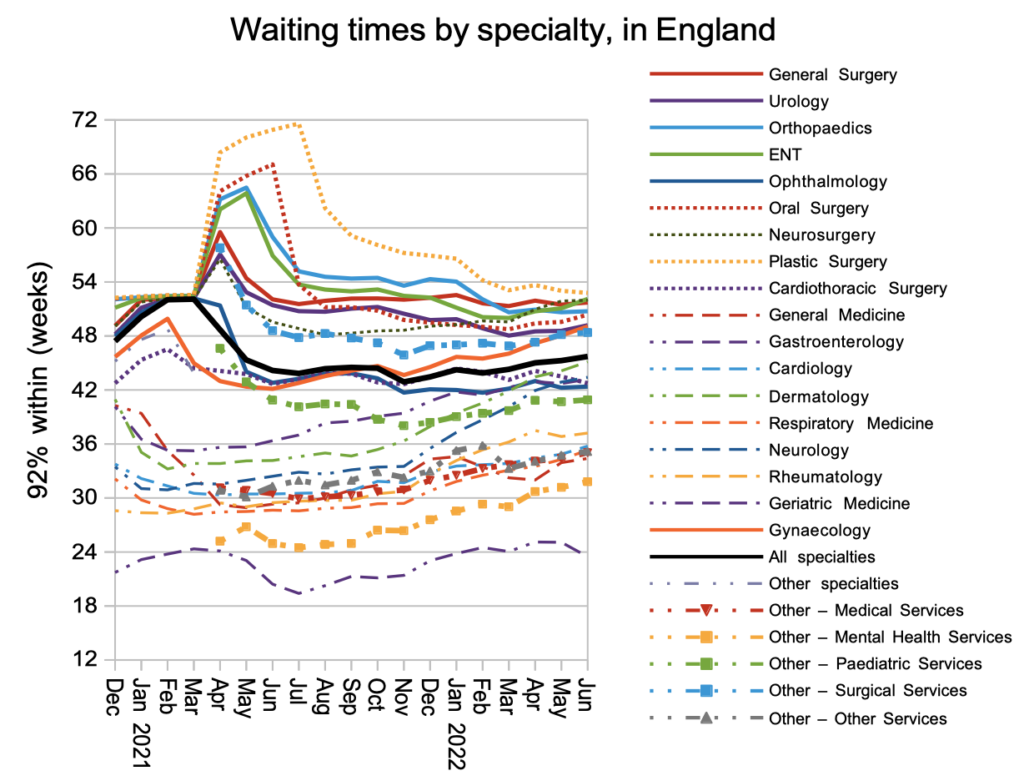
At specialty level there was little change in waiting times during June. The longest waiting specialties are overwhelmingly surgical, and while waits are comparatively shorter in medical specialties they are still historically and disturbingly long.
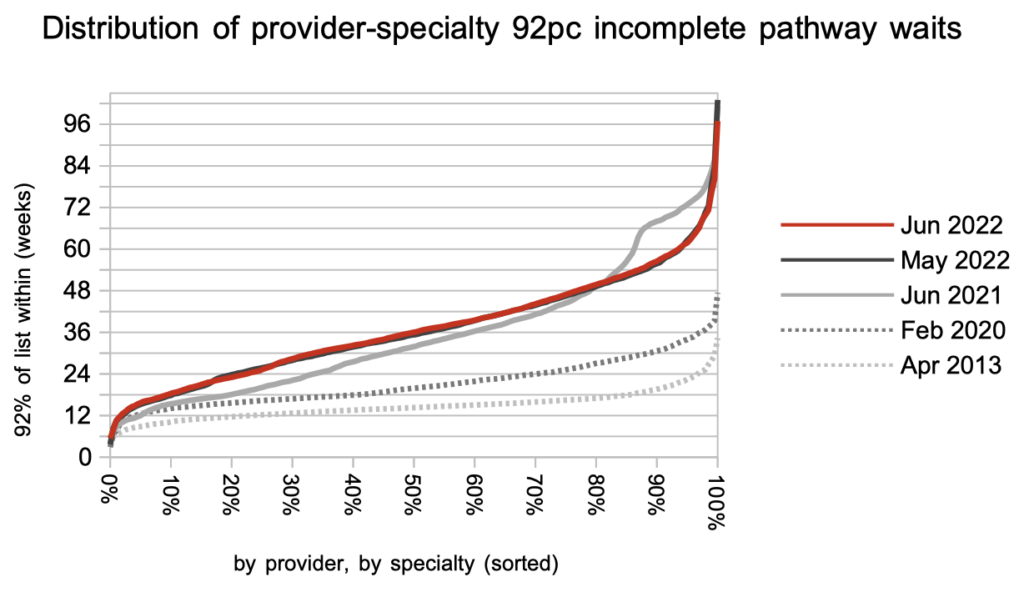
Looking at the local detail – the 2,500-odd sizeable local specialties within hospital providers – we can see that waiting times are much longer than pre-pandemic across the board. This chart shows how long 92 per cent of the waiting list is waiting, so services that are within 78 weeks on this measure may already face difficult choices when trying to achieve the April 2023 target that 100 per cent of the waiting list should be within 78 weeks.
Referral-to-treatment data up to the end of July is due out [NHS England statistics calendar] at 9:30am on Thursday 8th September.