

Waiting times after referral have reached nine months for diagnosis and decision, and ten months for treatment. But the experience of individual patients varies enormously.
Analysis produced for Health Service Journal by Dr Rob Findlay, Director of Strategic Solutions at Insource Ltd and founder of Gooroo Ltd
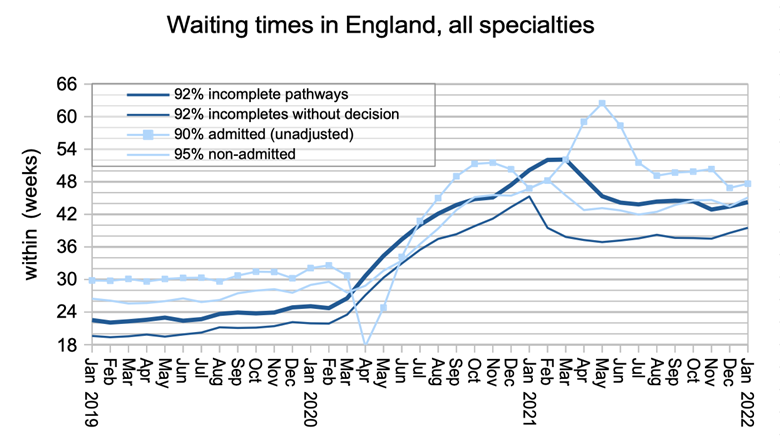
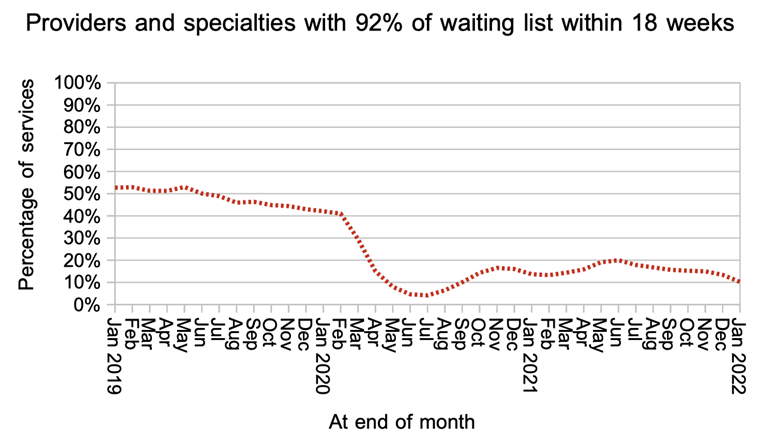
Elective waiting times worsened again in January according to the latest data for England, with overall referral-to-treatment (RTT) waits rising from 43.4 to 44.2 weeks. Only 10 per cent of local specialties were achieving the statutory 18-week waiting time standard at month end.
The wait from referral to diagnosis and decision rose from 38.6 weeks to 39.5 weeks, which is longer than nine months. Such lengthy delays put at risk those patients who have an urgent clinical condition such as cancer that has not yet been detected, and delay ‘waiting well’ management for many others.
The number of patients who were waiting longer than 104 weeks (2 years) from referral to treatment jumped from 20,065 to 23,778 patient pathways. The planning guidance for 2022-23 asks that this be reduced to zero by July except where patients choose to wait longer.
The underlying cause of the deterioration is that the NHS is struggling to keep up with the demand for elective care, even though new referrals are still running lower than pre-pandemic rates.
In the following discussion, all figures come from NHS England. If you have a national statistic that you’d like to check up on, you can download our waiting times fact checker.
The numbers
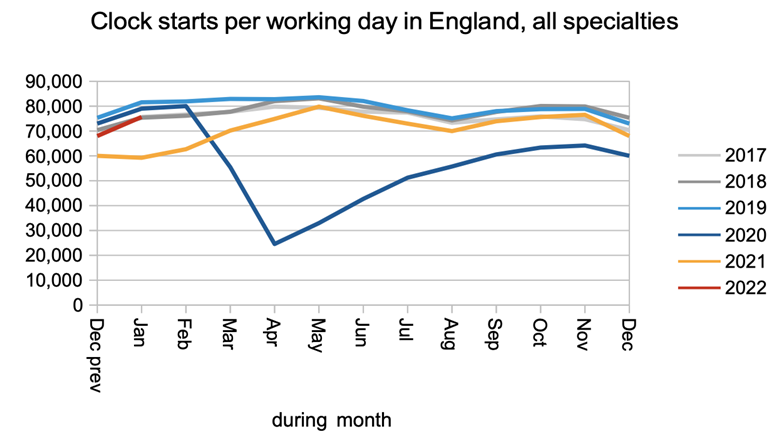
New referrals (measured here as RTT clock starts) are still running below pre-pandemic levels, with no sign yet of any surge caused by ‘missing referrals’ coming back.
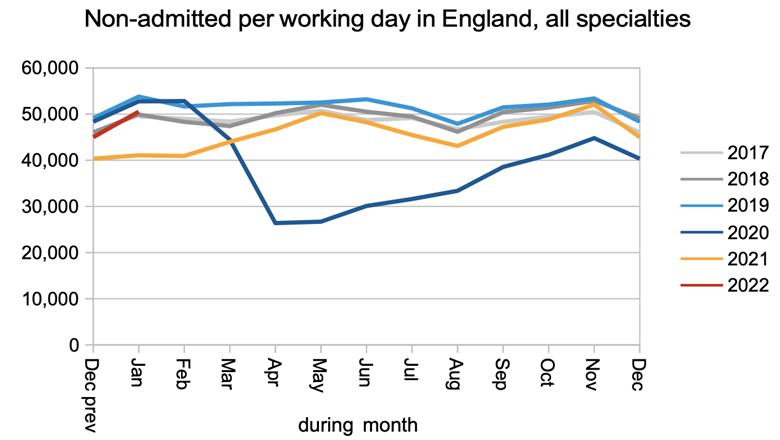
Non-admitted clock stops, where patients are removed from the waiting list following a clinic appointment or because they no longer need to be on the list, are also running a little below pre-pandemic levels.
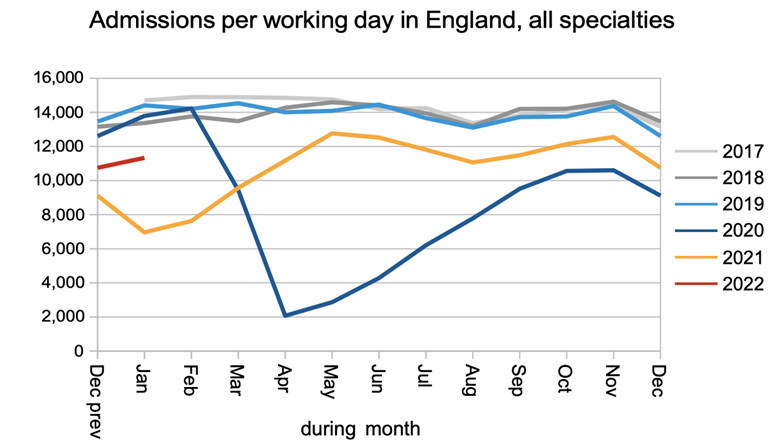
The rate that patients are admitted for treatment as inpatients and daycases is still running well below pre-pandemic levels, reflecting the continued constraints on capacity caused by covid.
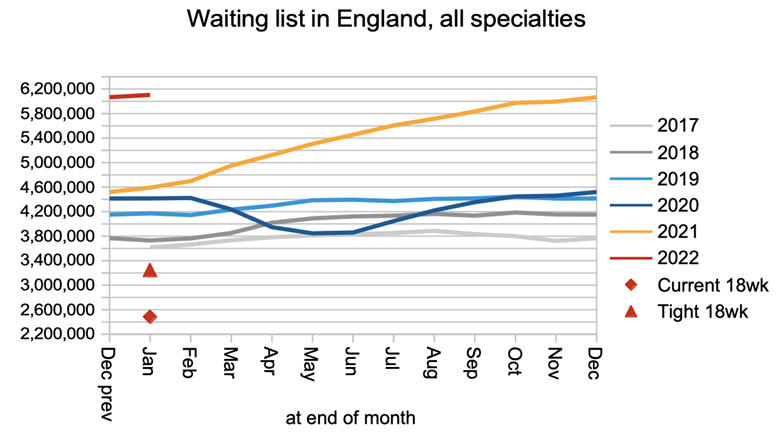
The net result of near-pre-pandemic demand and below-pre-pandemic admissions is that the waiting list is continuing to grow. It would need to shrink from 6.1 million to about 3.2 million before the 18-week standard could be achieved again.
Waiting times grew as well in January. Waiting times from referral to treatment rose by 5 days, and the wait from referral to diagnosis and decision to admit rose by almost a week.
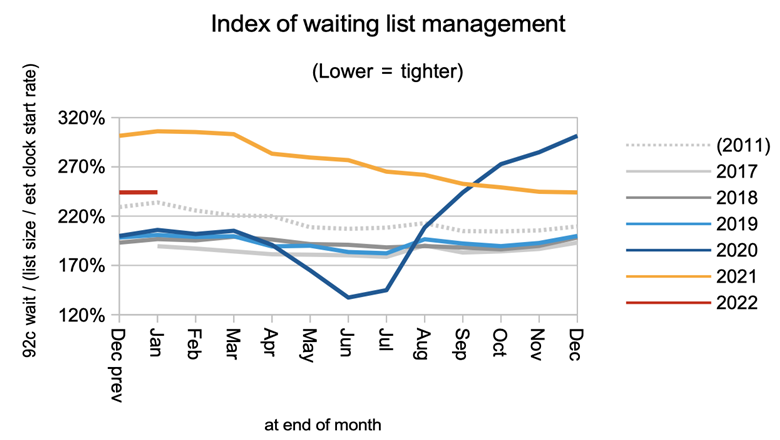
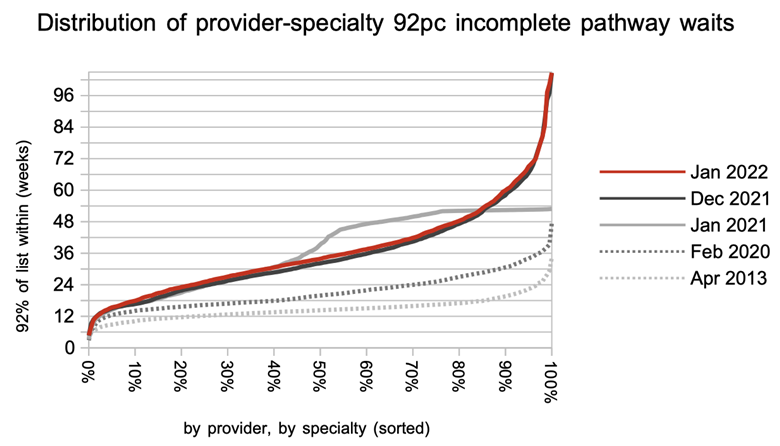
Waiting times are a function of both the size and shape of the waiting list. The shape remained unchanged in January, and still considerably worse than pre-pandemic. This means there is scope to improve waiting times by evening out the waiting times between different clinical services, and by booking patients by clinical priority and in date order.
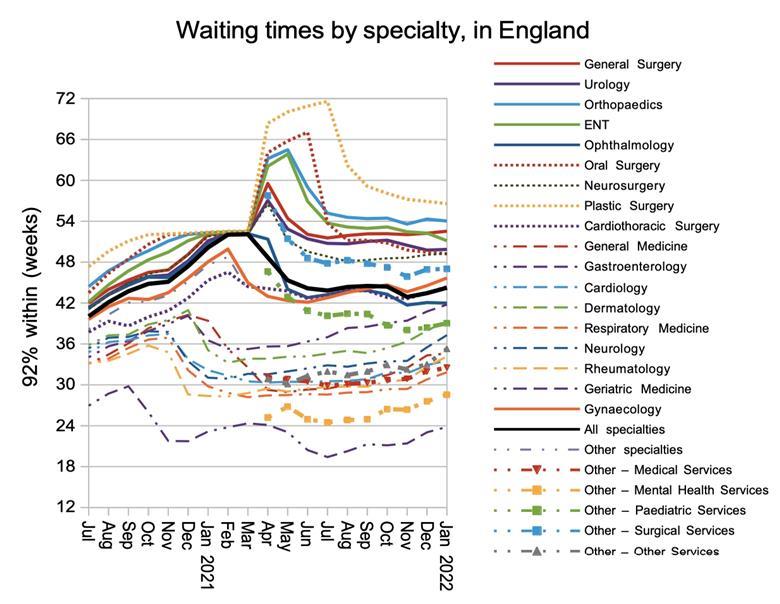
Waiting times nationally are longer than 52 weeks in three specialties: Plastic Surgery, Orthopaedics, and General Surgery. In January, waiting times were rising fastest in medical specialties.
Waiting times have grown so long during the pandemic that there has seemed little point in tracking performance against the statutory 18-week standard. But perhaps we should revisit it every now and again, if only to remind ourselves where we want to recover to. At the end of January, only 10 per cent of local services were achieving the standard.
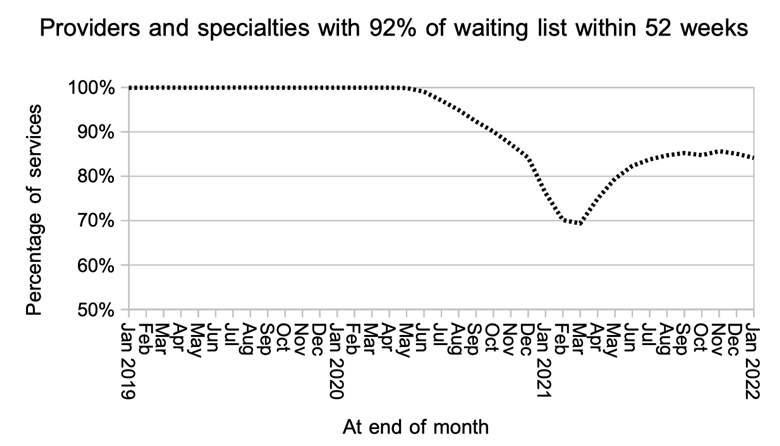
The planning guidance for 2022-23 asks for a reduction in 52 week waits, with ambition to eliminate them by March 2025. At the end of January only 84 per cent of local services were even achieving 92 per cent of the waiting list within 52 weeks, a full percentage point worse than the month before.
The deterioration in waiting times happened very broadly, for services with short waits as well as long.
The statistics calendar for 2022-23 had not been released at the time of writing, but we can make an educated guess that RTT data for February will be published as usual on the second Thursday of the month which is the 14th of April.