

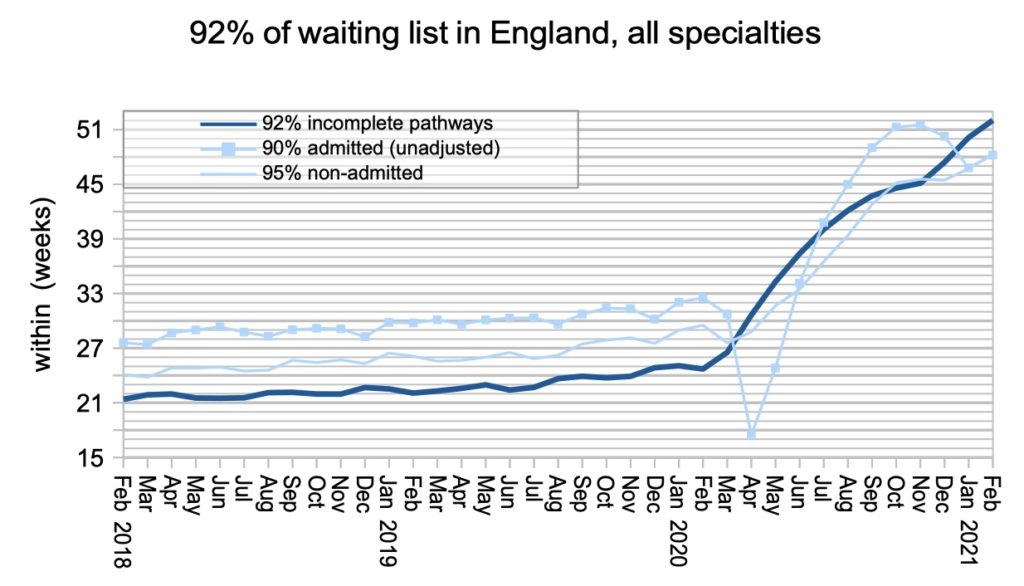
The NHS in England is required by legislation to ensure that at least 92 per cent of patients on the waiting list have been waiting no longer than 18 weeks from referral to treatment (RTT). At the end of February, following a year of covid restrictions, that waiting time measure exceeded 52 weeks.
How much longer than 52 weeks? We don’t know, because the data stops at “52 plus”. But there is good news, because this is about to change.
Guidance was issued during March requiring two major improvements to the published RTT data.
Firstly, instead of stopping at 52 weeks plus, the weekly waiting time cohorts will continue up to 104 weeks plus.
Secondly, we are going to get a lot more information about mental health and other RTT waiting times, because the catch-all “Other” specialty is going to be broken down into medical, surgical, mental health, paediatric and the rest.
There are also hints in the guidance that all mental health trusts are going to be required to live up to their obligations to submit RTT data. If you think of several mental health trusts who definitely provide consultant-led care, and try to find them in the data, not all of them are there. Nor are they listed under “missing data” in the press notice. Comprehensive mental health coverage in the RTT data will be very welcome, because of the importance of short RTT waits for mental health patients.
In the following discussion, all figures come from NHS England and NHS Improvement. If you have a national statistic that you’d like to check up on, you can download our waiting times fact checker.
For analysis of waiting times performance at a particular organisation, visit our reports page, or our map of the latest RTT waiting times across England.
England-wide picture
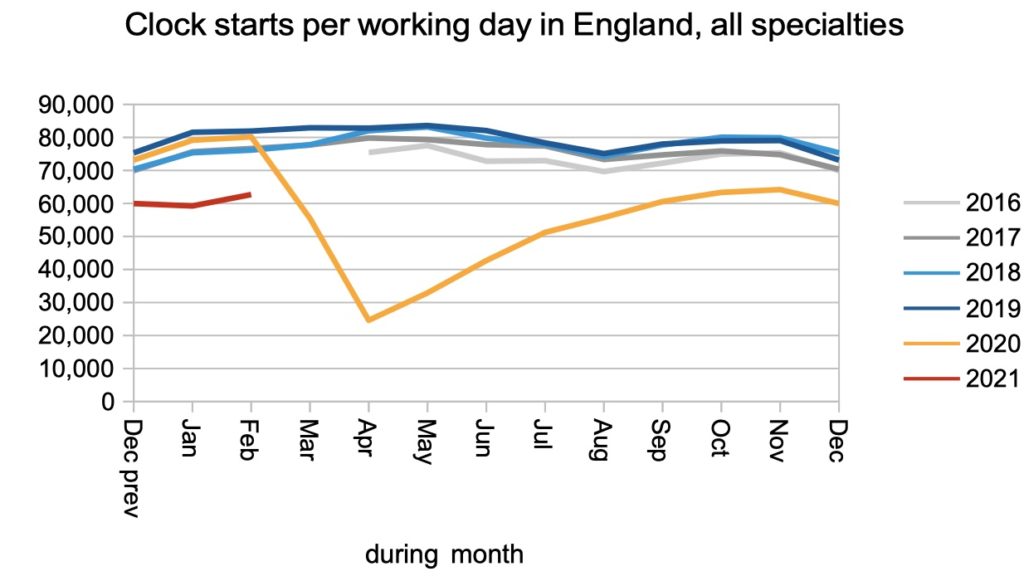
Referrals to consultant led services (RTT clock starts) remained lower than pre-covid levels, which means that the pent-up demand for care is probably still growing. We can expect many of the missing referrals since March 2020 to come back later this year, but nobody knows how many actually will.
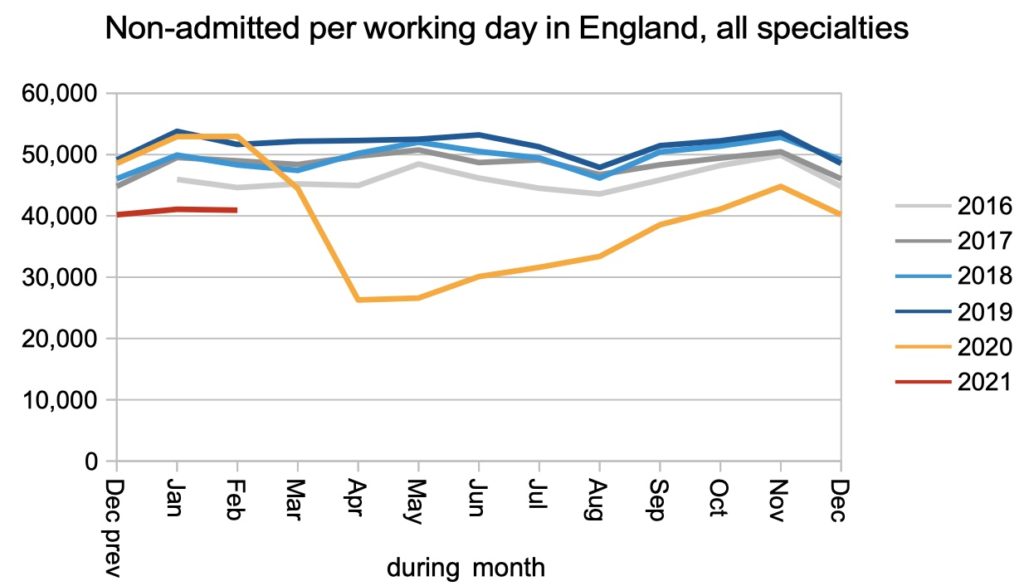
The number of patients discharged following an outpatient appointment, or for other reasons that do not involve an inpatient or daycase admission (non-admitted RTT clock stops) also remained below pre-covid levels. This suggests that outpatient activity has not yet fully recovered.
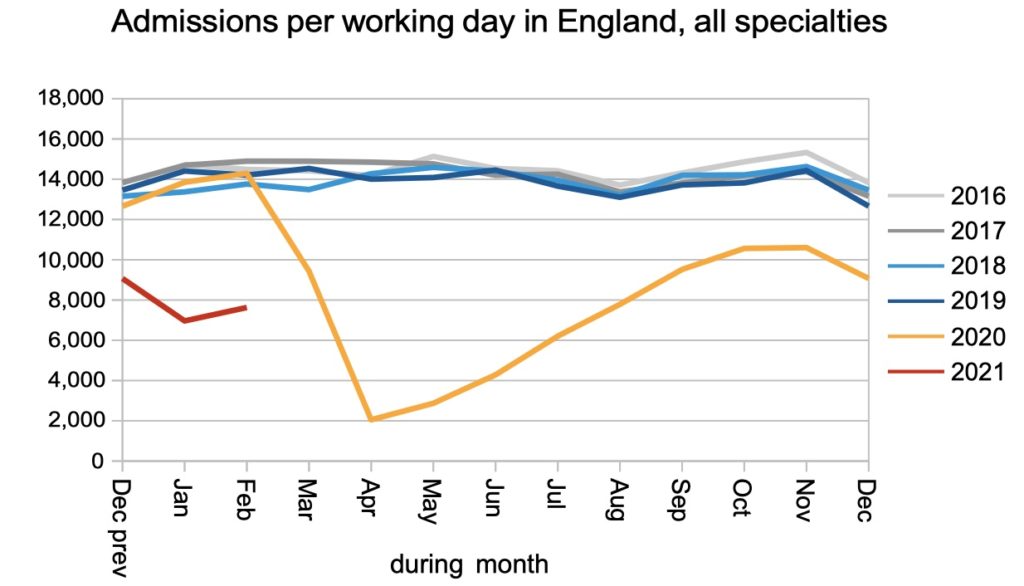
The number of patients admitted for inpatient or daycase treatment (admitted RTT clock stops) was around half the pre-covid level. This is the most difficult activity to recover under covid restrictions because, by definition, there is no alternative to the patient attending in person.
Whereas missing referrals can be expected to come back in the future, missing activity is lost forever. It can only be recovered by doing more, and this is going to be expensive. Until activity rises to exceed demand there will be no elective recovery.
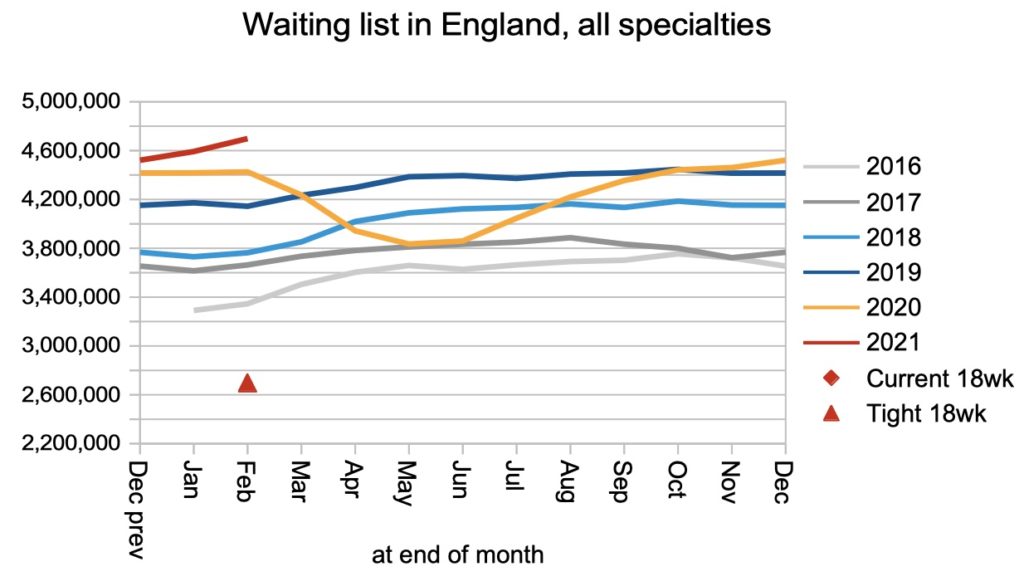
The net result of fewer patients being added to the waiting list, and fewer coming off it, was that the waiting list grew a bit. This is already the largest RTT waiting list since records began in 2007, and the growth is likely to accelerate as patients come back to the NHS after staying away during the pandemic.
Waiting times have now maxed out at 52 weeks plus for England as a whole. In a couple of months, the detailed data will extend to 104 weeks, which will be a big improvement.
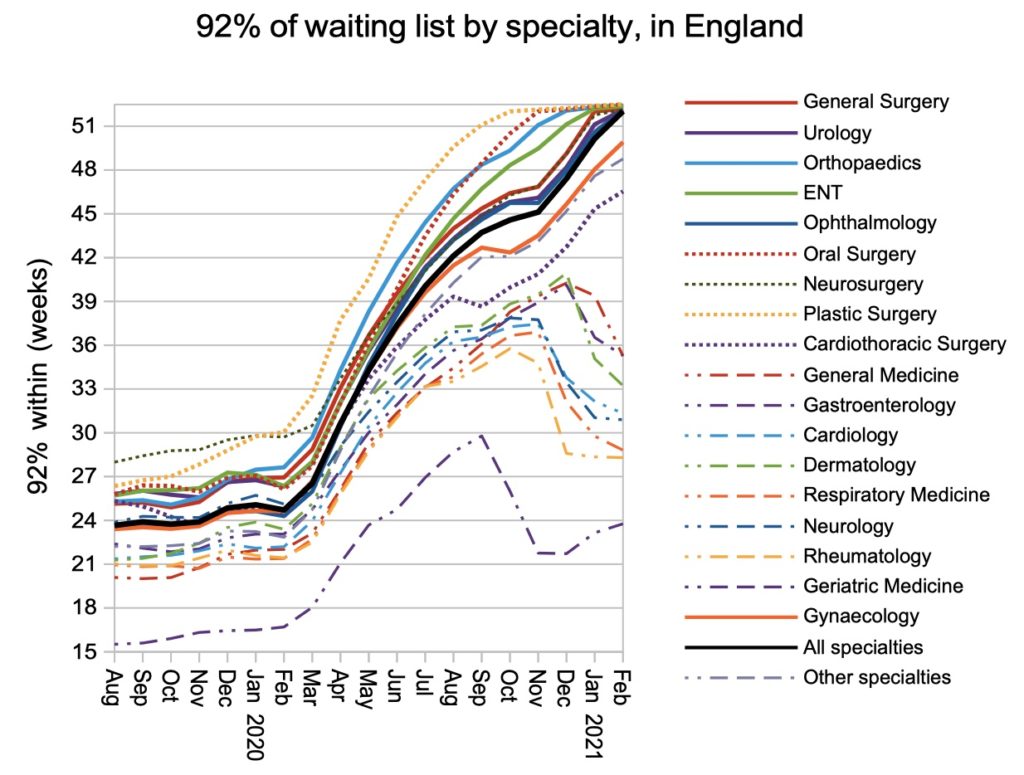
Eight of the 18 identified specialties have now maxed out at 52 weeks plus, including most surgical specialties. As noted above, the “Other” category is going to be split into five sub-categories starting with the data for April, identifying mental health RTT waits separately for the first time.
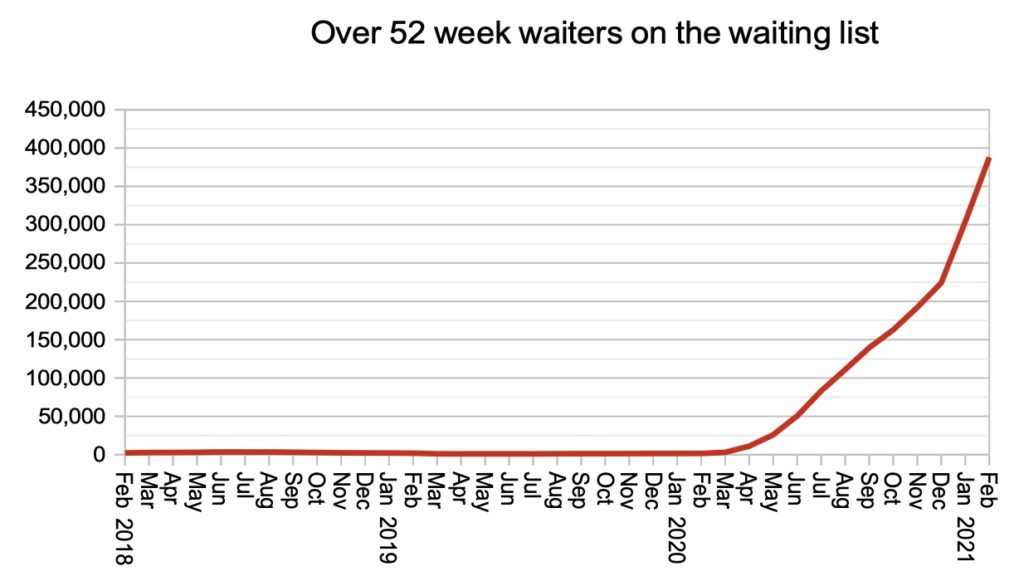
The number of over 52 week waiters continues to soar. I am expecting the numbers to start falling after April, caused by a combination of the anniversary of the first covid shutdown (when few patients were referred) and the recovery in elective activity. But this will be a false dawn because pent-up demand will be coming back and the underlying waiting list pressures will be growing.
Local picture
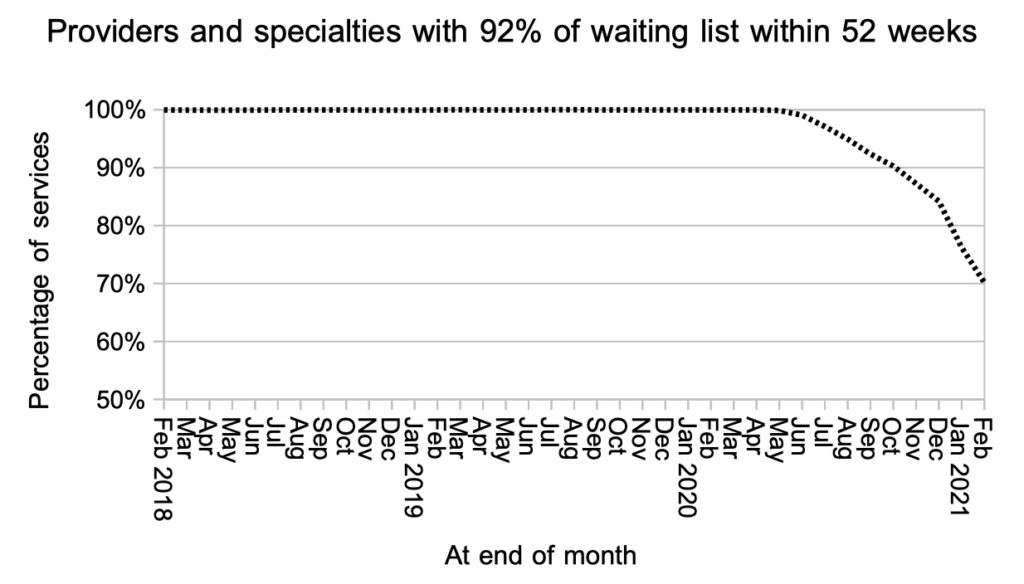
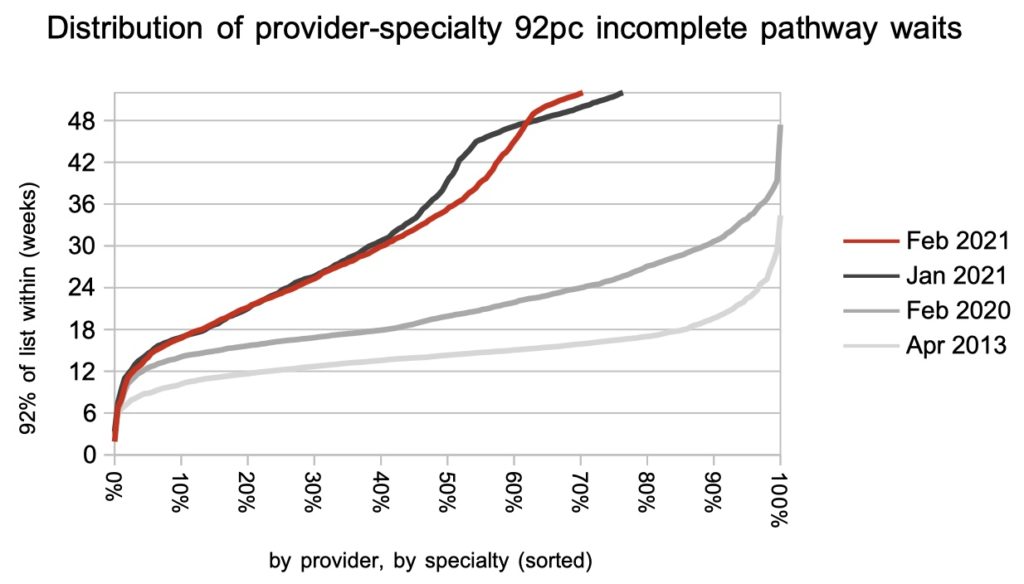
I have had to extend the scale on the next chart again, because only 70 per cent of local specialties within providers have at least 92 per cent of their waiting lists within 52 weeks.
The final chart shows the distribution of waiting times, by specialty by provider, omitting those services that have reached 52 weeks plus.
Referral-to-treatment data for March 2021 is due out at 9:30am on Thursday 13th May 2021.