

The number of over-one-year waiters on the English waiting list shot up 20 per cent in February, as the elective admission rate continued to slump in the face of exceptional winter pressures.
Nor is there any relief in sight. The Type 1 A&E data, which is released a month ahead of referral-to-treatment (RTT) waiting times data, showed record poor A&E performance continuing through March, suggesting that winter pressures may hammer RTT admission rates for some time to come.
For analysis of waiting times performance at a particular organisation, visit our reports page. You can also access maps of the latest waiting times across England for A&E, cancer, and RTT.
In the following discussion, all figures come from NHS England. If you have a national statistic that you’d like to check up on, you can download our RTT waiting times fact checker.
England-wide picture
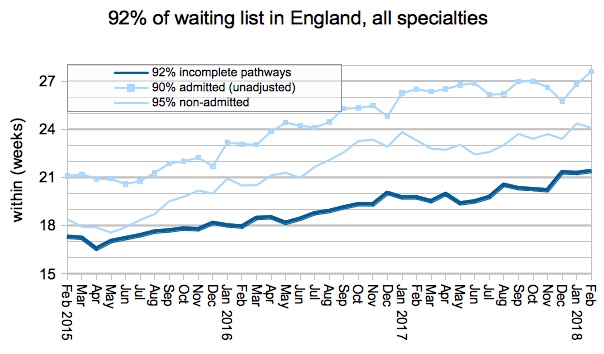
Waiting times edged up in February, which is ominous because normally there is a seasonal improvement at this time of year.
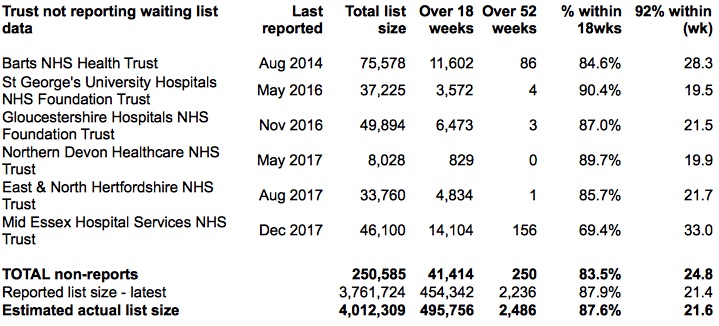
Liverpool Women’s NHS Foundation Trust restarted reporting after a one month absence (well done them). Their waiting list is quite small so this makes little difference to the national figures. Overall the estimated number of unreported waiting list patients remains close to the record high – nearly 300,000 – which was set in November.
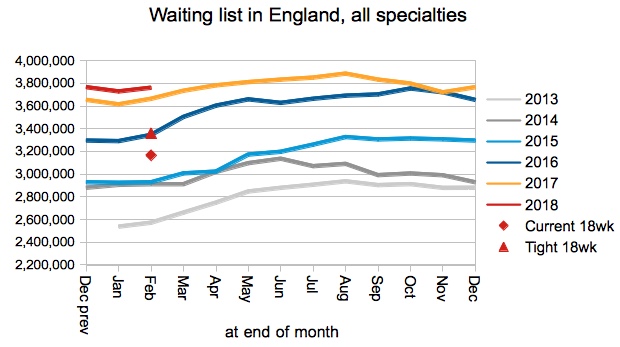
The waiting list grew slightly in February which is typical of the season. The triangle in the chart below shows that a large reduction in the national waiting list would be needed to restore the NHS Constitution ’18 weeks’ standard, even if national waiting list management returned to the tighter 2013-16 levels.
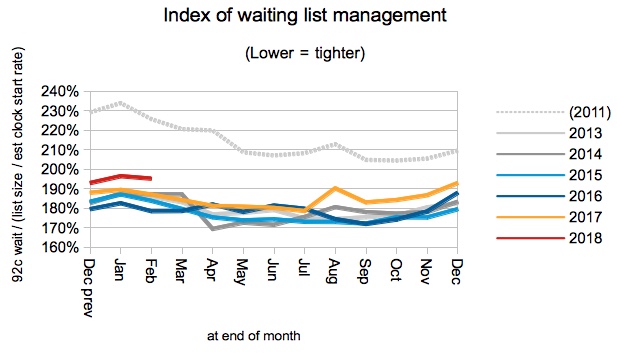
Talking of national waiting list management, the chart below shows that this remains looser than the 2013-16 average, which is a sign of a higher level of inequality of waiting times across the country.
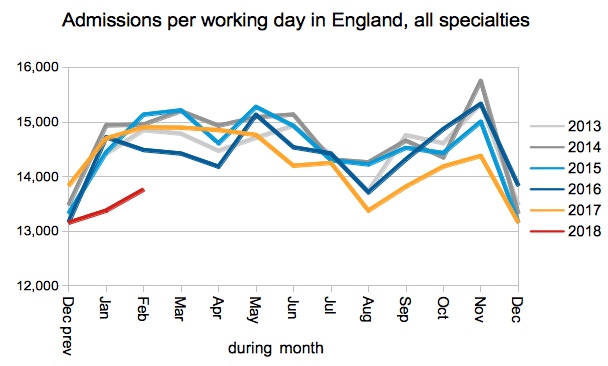
Admissions per working day continued the spectacular collapse seen in January, when elective admissions were cancelled to release beds for emergency patients.
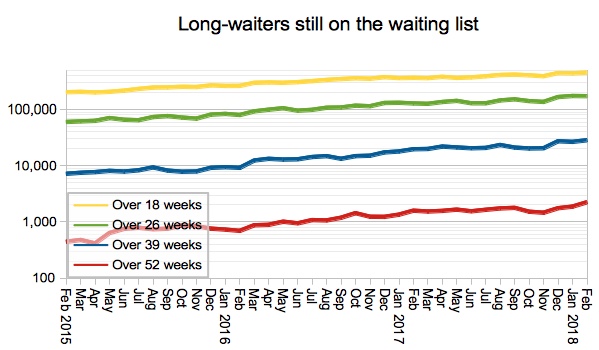
The number of one year waiters shot up by 20 per cent during February, from 1,869 to 2,236 (or, if you adjust for the last known positions at non-reporting trusts, from 2,119 to 2,486). Either way, this is the worst performance on one year waits since July 2012, the time when long waits were falling sharply after the successful introduction of the incomplete pathways standard.
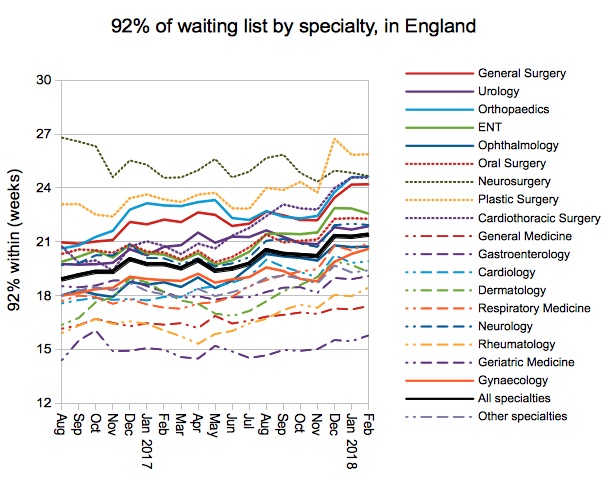
At specialty level, Rheumatology slipped over the line in February, leaving only Geriatric Medicine and General Medicine in national compliance with the 18 week standard. They aren’t big waiting list specialties though; between them they comprise less than 2 per cent of the total waiting list.
Local detail
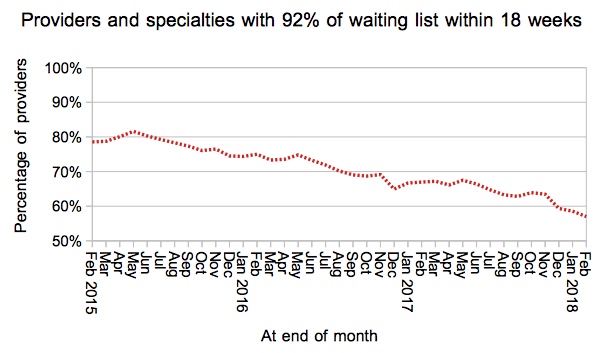
Of the 2,500 local specialties within trusts, only 57 per cent are now achieving the 18 week standard. If this rate of decline continues, achieving the target will be a minority sport by autumn.
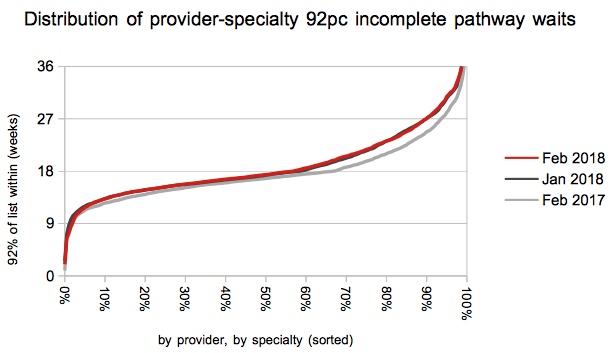
If you plot the waiting times of those 2,500 local services, after sorting them in order, you get the curve shown below. The point where the red line crosses 18 weeks is the value charted in the time series above.
The long waiting end of the curve is continuing to peel up from the 18 week line, as waiting times become more unequal around the country. A year ago the standard deviation of these waiting times was 5.2 weeks, and now that inequality has increased to 5.8 weeks.
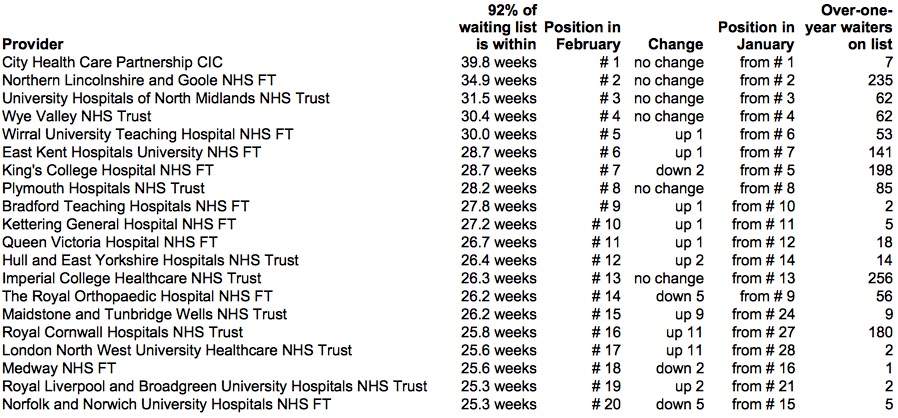
There was a little jostling at the bottom of the table of longest-waiting trusts during February, with four new entrants. Aside from that, it is quite astonishing that a trust’s waiting time has to be over 25 weeks even to make it into the top twenty.
The statistics calendar for 2018-19 has been published, and RTT data for March is due out at 9:30am on Thursday 10th May.