

The number of patients waiting longer than 65 weeks and 78 weeks from referral to treatment (RTT) fell sharply in March, as the English NHS stepped up activity towards the end of the financial year.
Analysis produced for Health Service Journal by Dr Rob Findlay, Director of Strategic Solutions at Insource Ltd and founder of Gooroo Ltd
Over-65-week waiters fell from 75,000 to 49,000 (compared with a target of zero, which was recently pushed back from March to the end of September 2024). Over-78-week waiters fell from 10,000 to 5,000 (target of zero, missed since April 2023).
However the waiting time experience of most patients did not change, as the national waiting list and waiting times remained almost steady at 7.54 million pathways and 44.7 weeks. The very longest waiters also barely changed, with over-104-week waiters falling only slightly from 252 to 232 (target of zero, missed since July 2022).
All these figures exclude community services which have been dropping out of the data since February under new rules, and a large mental health trust also stopped reporting in March. However those omissions only explain a small amount of the improvement in very long waits, which is therefore likely to be real.
In the following discussion, all figures come from NHS England. You can look up your trust and its prospects for achieving the current waiting time targets here.
The numbers
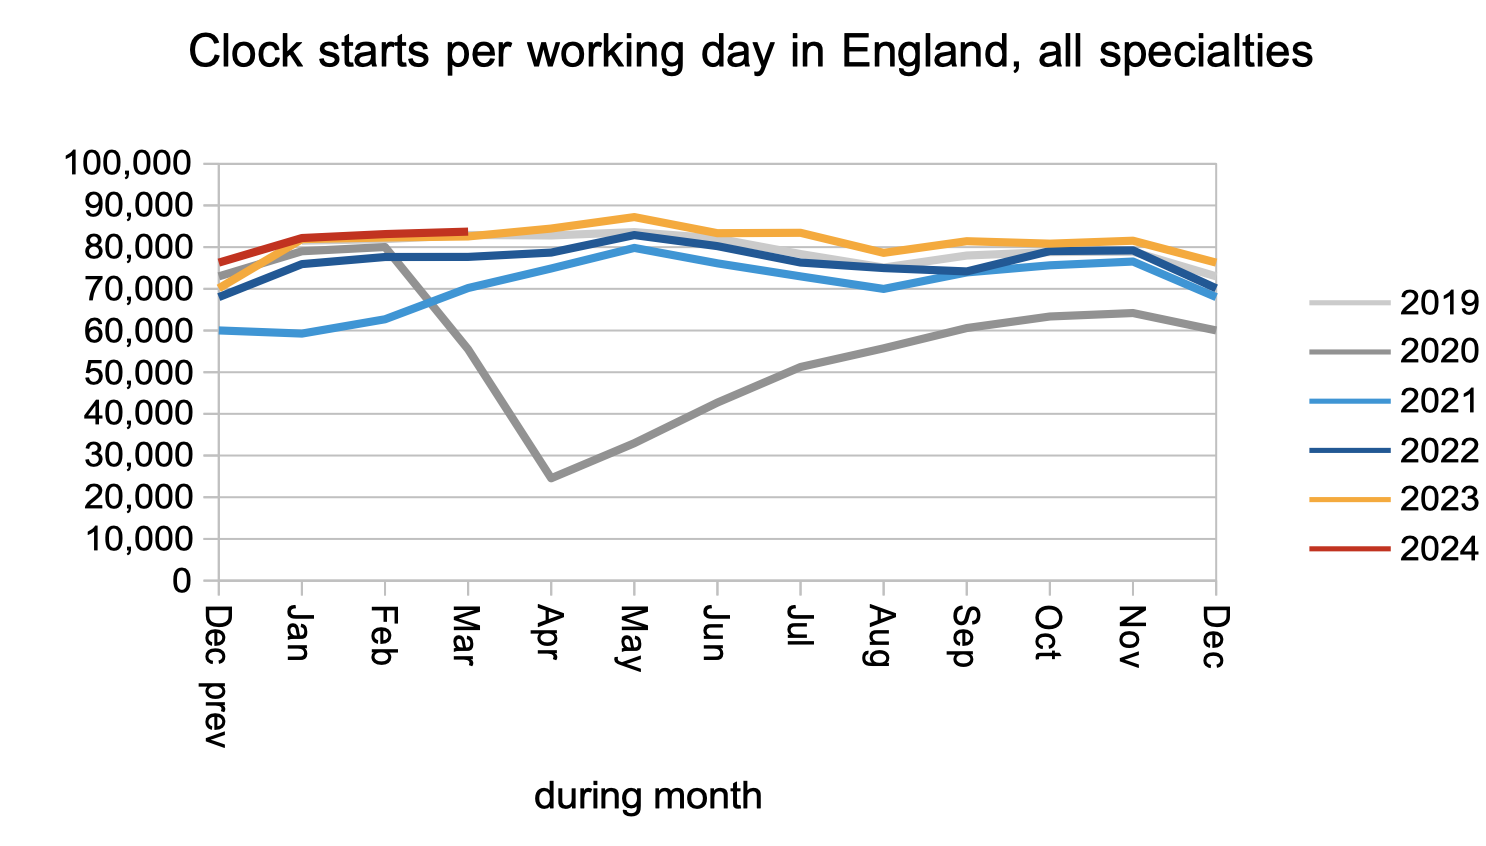
Demand remained steady in March, as measured by the number of patients starting new waiting time ‘clocks’.
There was a small but significant increase in patients leaving the waiting list for reasons other than admission. This includes discharges from outpatients and some administrative removals.
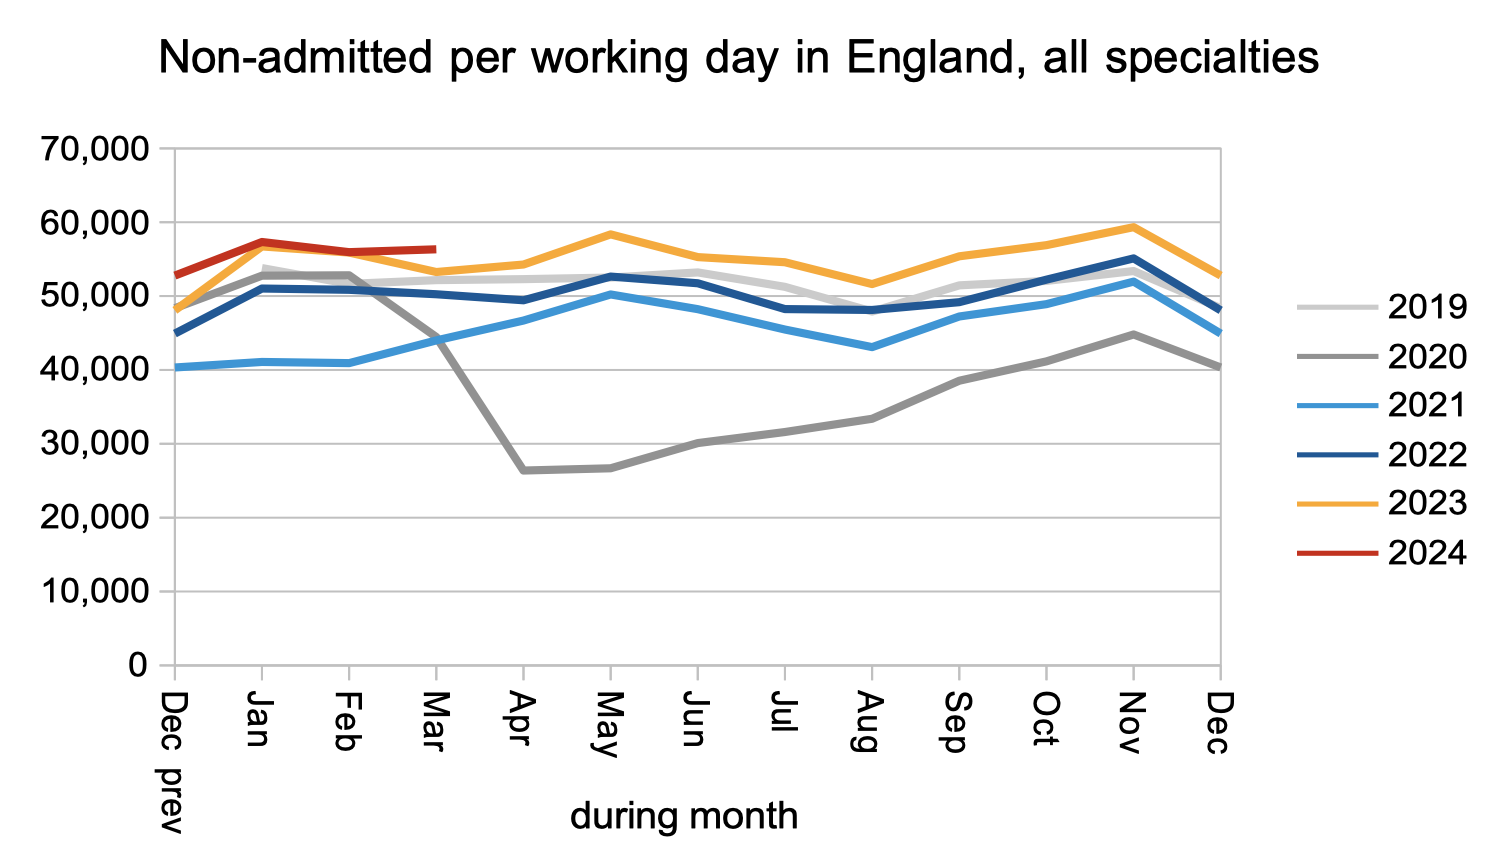
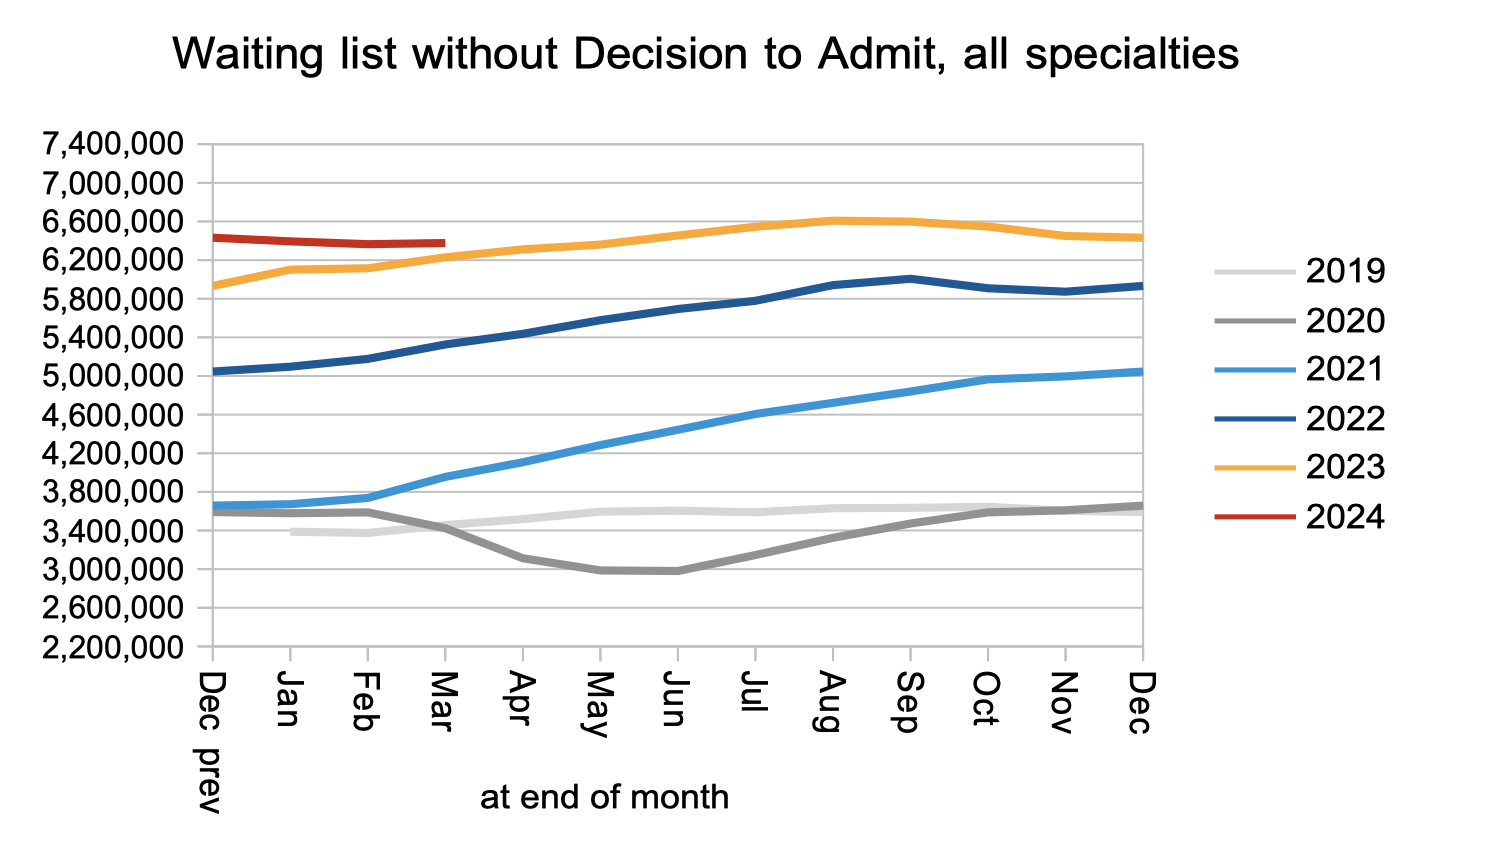
The net result of stable demand and a small increase in discharges from outpatients was a steady waiting list of patients awaiting diagnosis and decision to admit.
I estimate that they include 27,123 patients whose eventual diagnosis will unexpectedly be cancer. Because their cancer is not yet suspected, they are not on a cancer pathway and not protected by the cancer waiting time targets, so they can expect to wait as long as everyone else: typically 42.3 weeks, which is far too long for cancer.
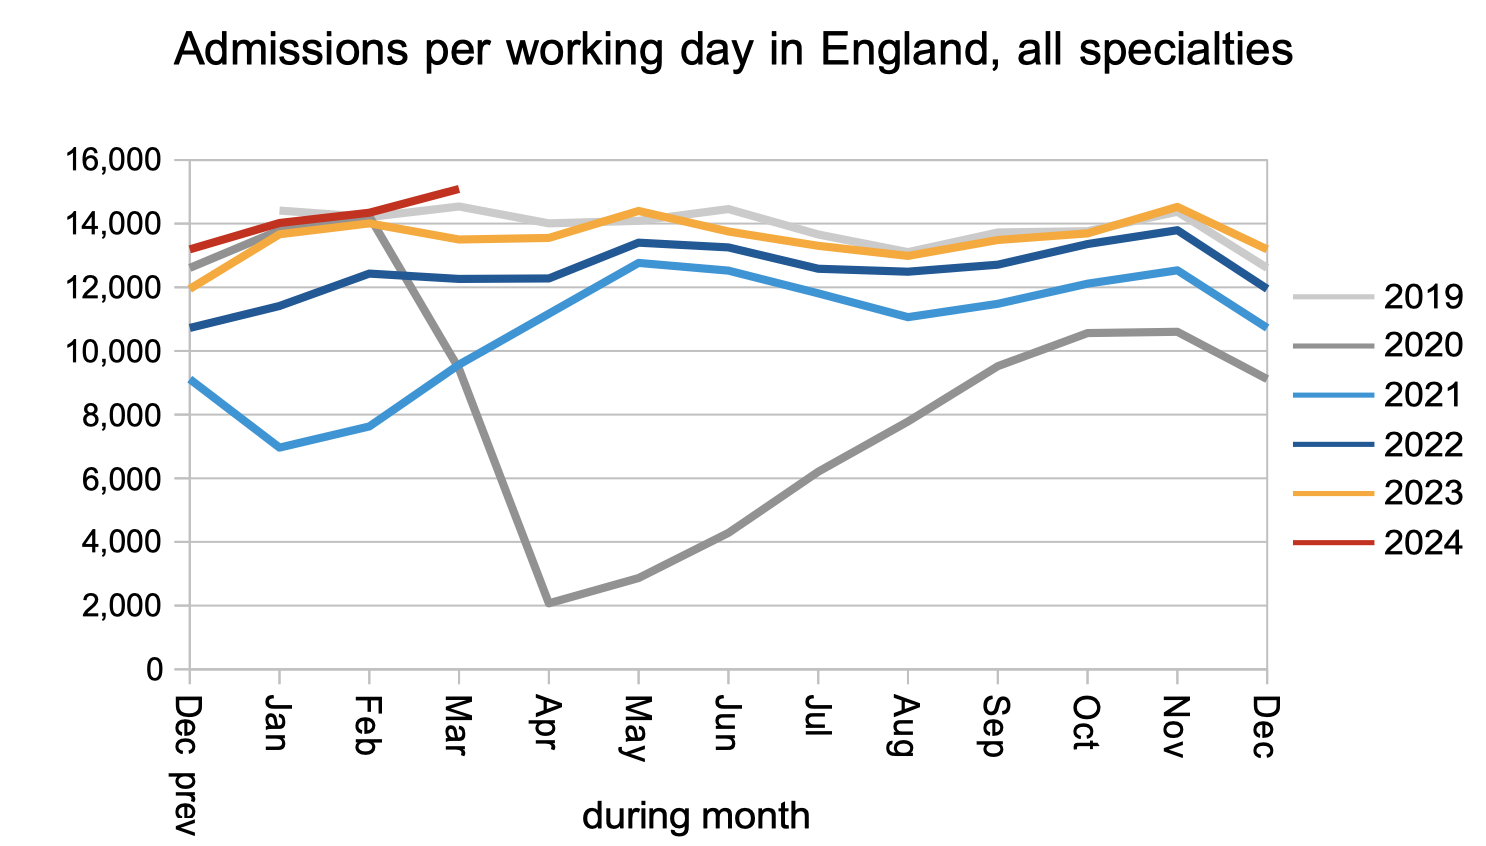
There was a significant increase in the rate that patients were admitted for treatment as inpatients and daycases. This is good news. Admission rates have been largely in the doldrums, and this resource-intensive work is essential for the longest waits to come down.
The net result of all of the above was that the RTT waiting list remained roughly steady. Although no acute trusts stopped reporting data, about 7,000 patient pathways disappeared from the data in March following the new rule that community services should be excluded from the RTT data. A further 8,000 disappeared because a large mental health trust did not report (more on that below).
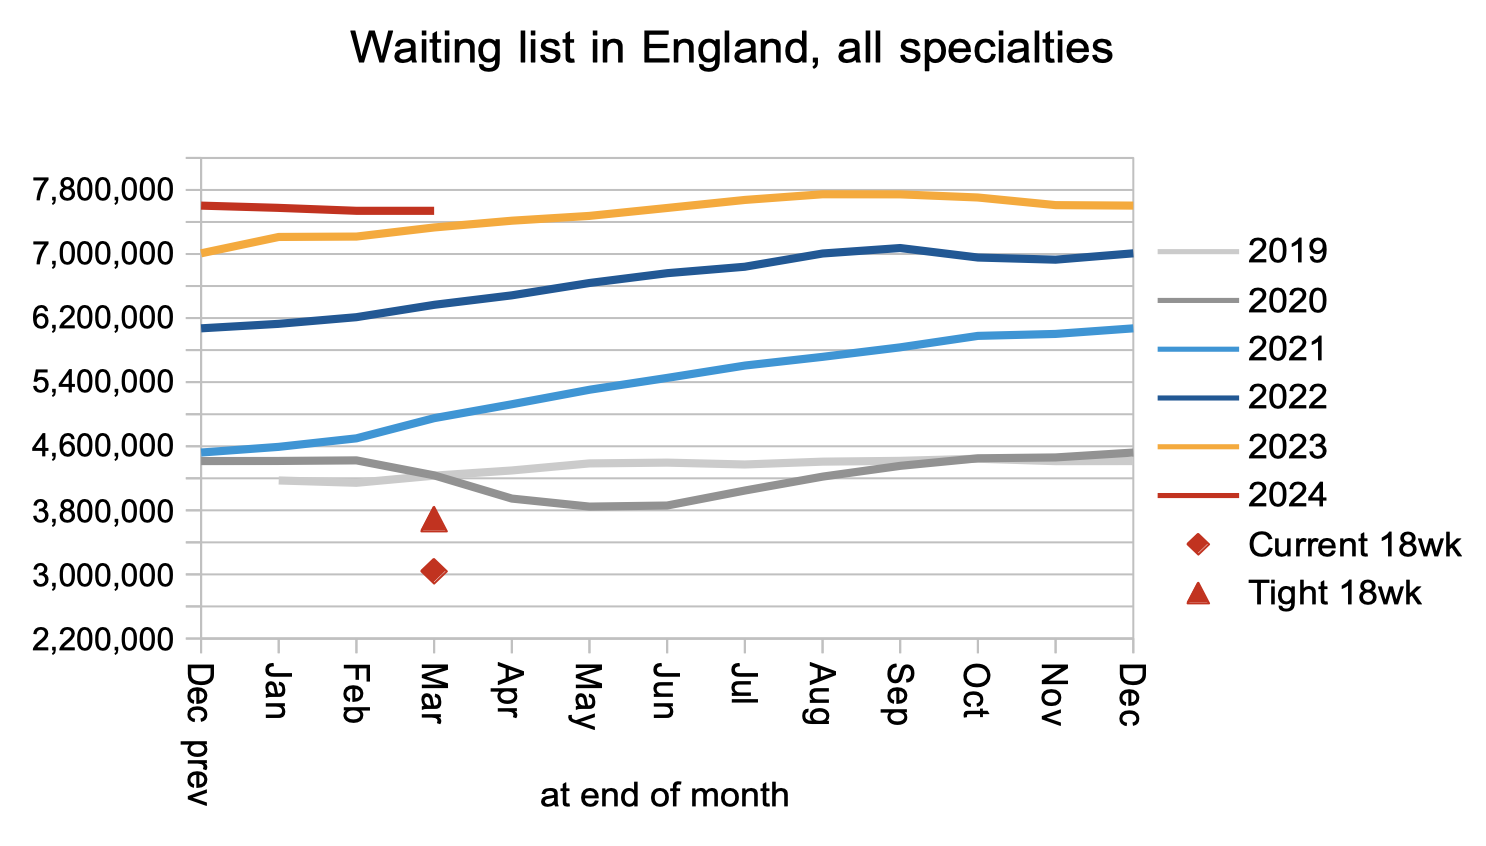
The red triangle and diamond show that the waiting list would need to fall to between 3 million and 3.7 million before the statutory 18 week target could be restored. The number depends on the waiting list shape, which we will discuss below.
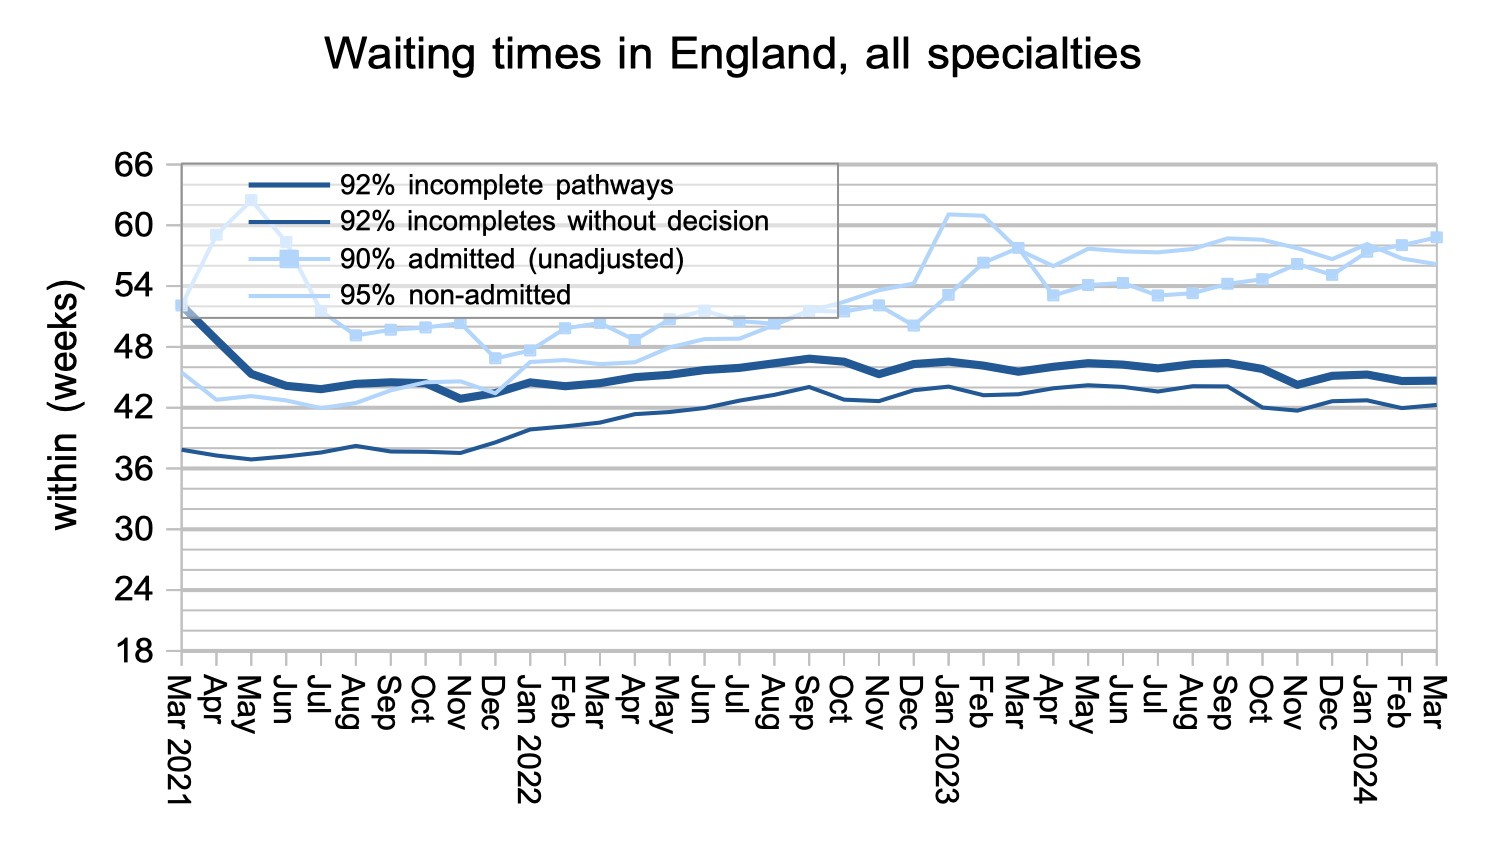
Waiting times remained steady, showing that the experience of most patients was unaffected by the reductions in very long waits. The pale line with squares shows that the NHS used some of the extra admitted activity to target those very long waiters.
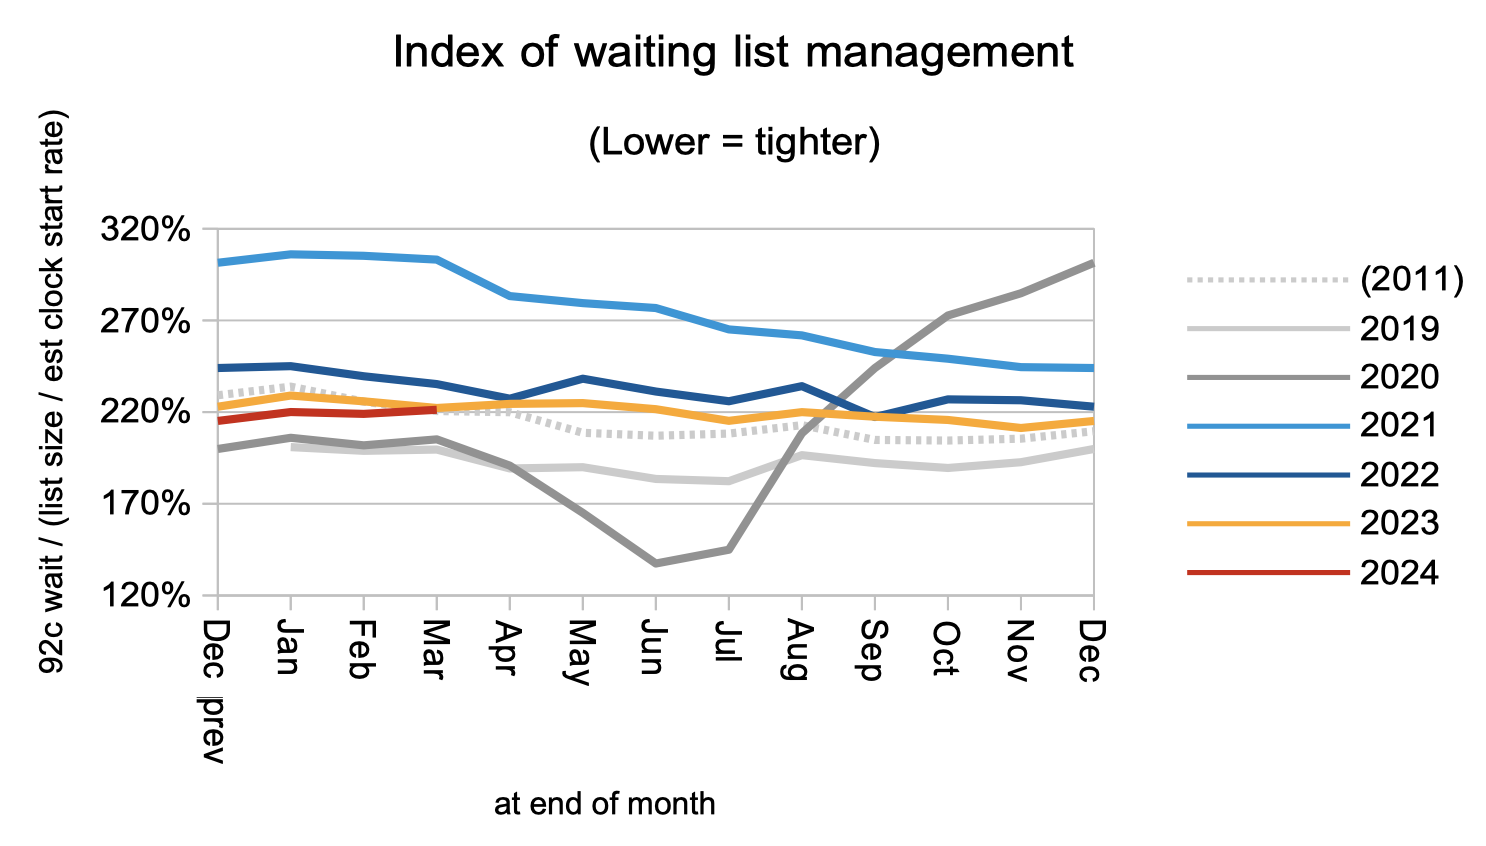
Waiting times are a function of both the size and shape of the waiting list, and the next chart is a measure of the shape. It remains worse than pre-pandemic, and sits at 2011 levels which predate the removal of disincentives to treat long waiters.
If 18 week waits are to be restored in the next Parliament, what can we assume about the waiting list shape? As we saw above, the shape determines whether the list size would need to fall all the way to 3 million, or whether 3.7 million would suffice (at current demand levels… but let’s not go into that here). Restoring the wait list shape to 2013-16 levels would require some rock-solid resource allocation to even out the variation in waiting time pressures between different hospitals and specialties, and I am inclined to err on the pessimistic side given the short timeframes and poor starting point.
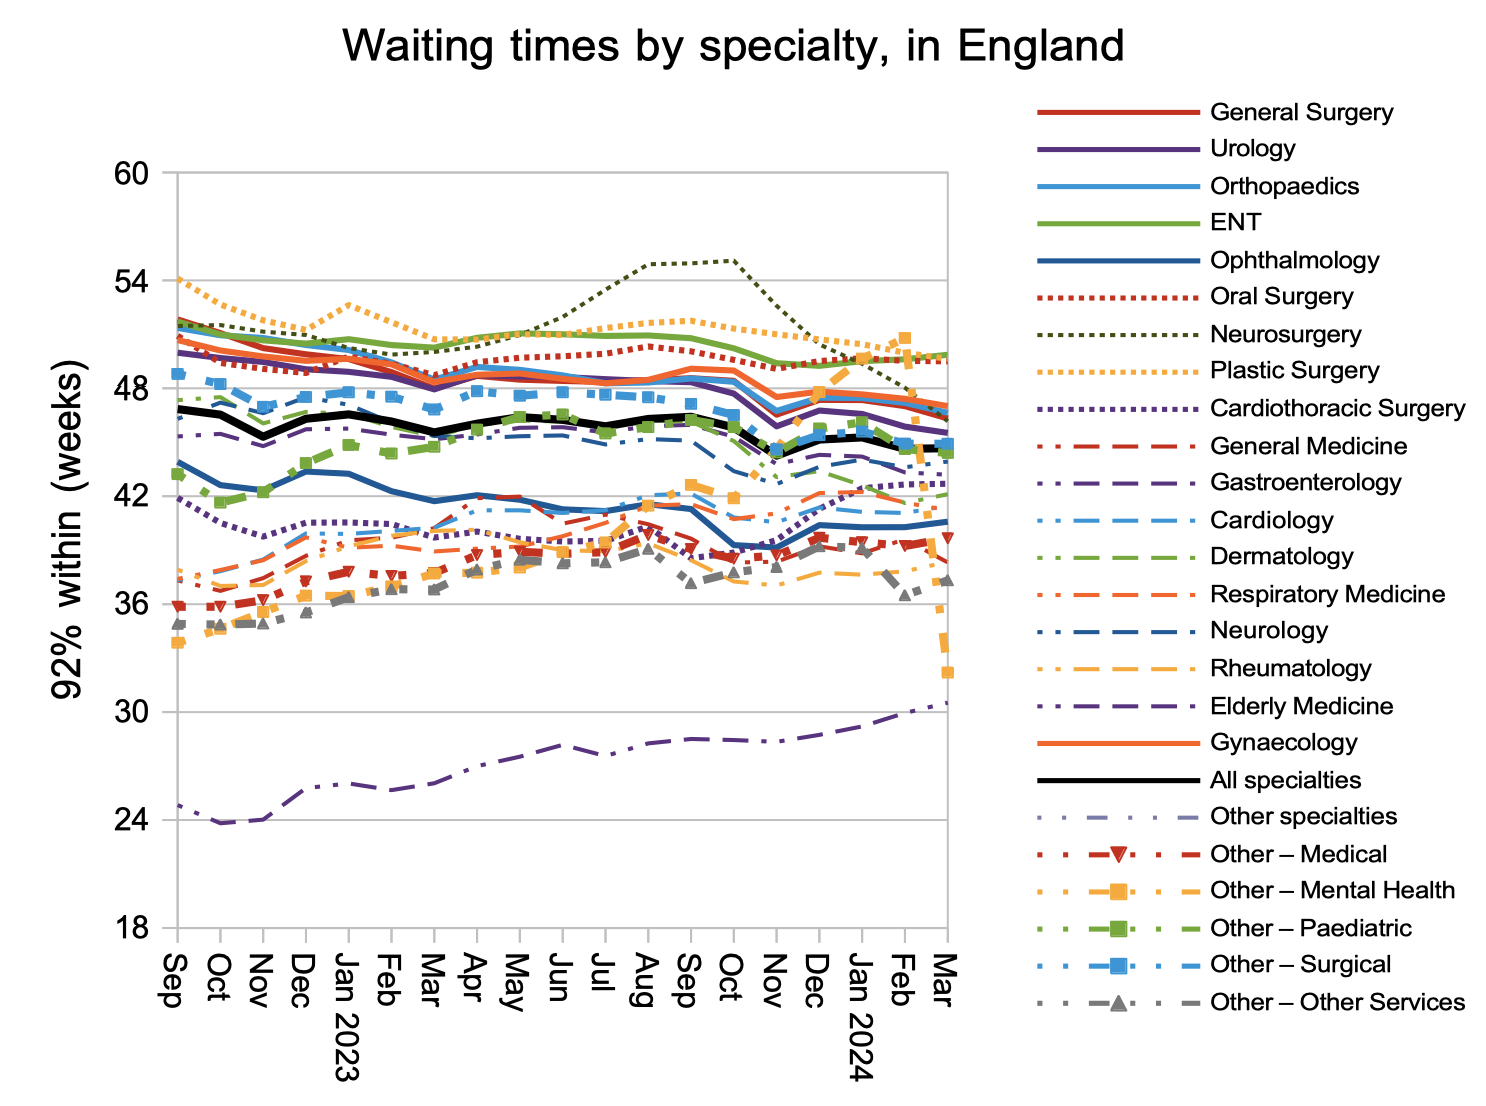
Looking at the national waits for each specialty, one line leaps out. Have mental health waits really gone from worst to nearly best in a single month? Unfortunately not. Those long waits in February were caused by one large mental health trust which stopped reporting in March.
It is unfortunately common for mental health trusts not to report their RTT data, even if they have dozens of consultants and must therefore have patients waiting for consultant-led services. Attention is not officially drawn to this problem, as the statistical press notice does not highlight missing data from non-acute trusts. The mental health RTT waiting time statistics cannot therefore be relied upon at national level.
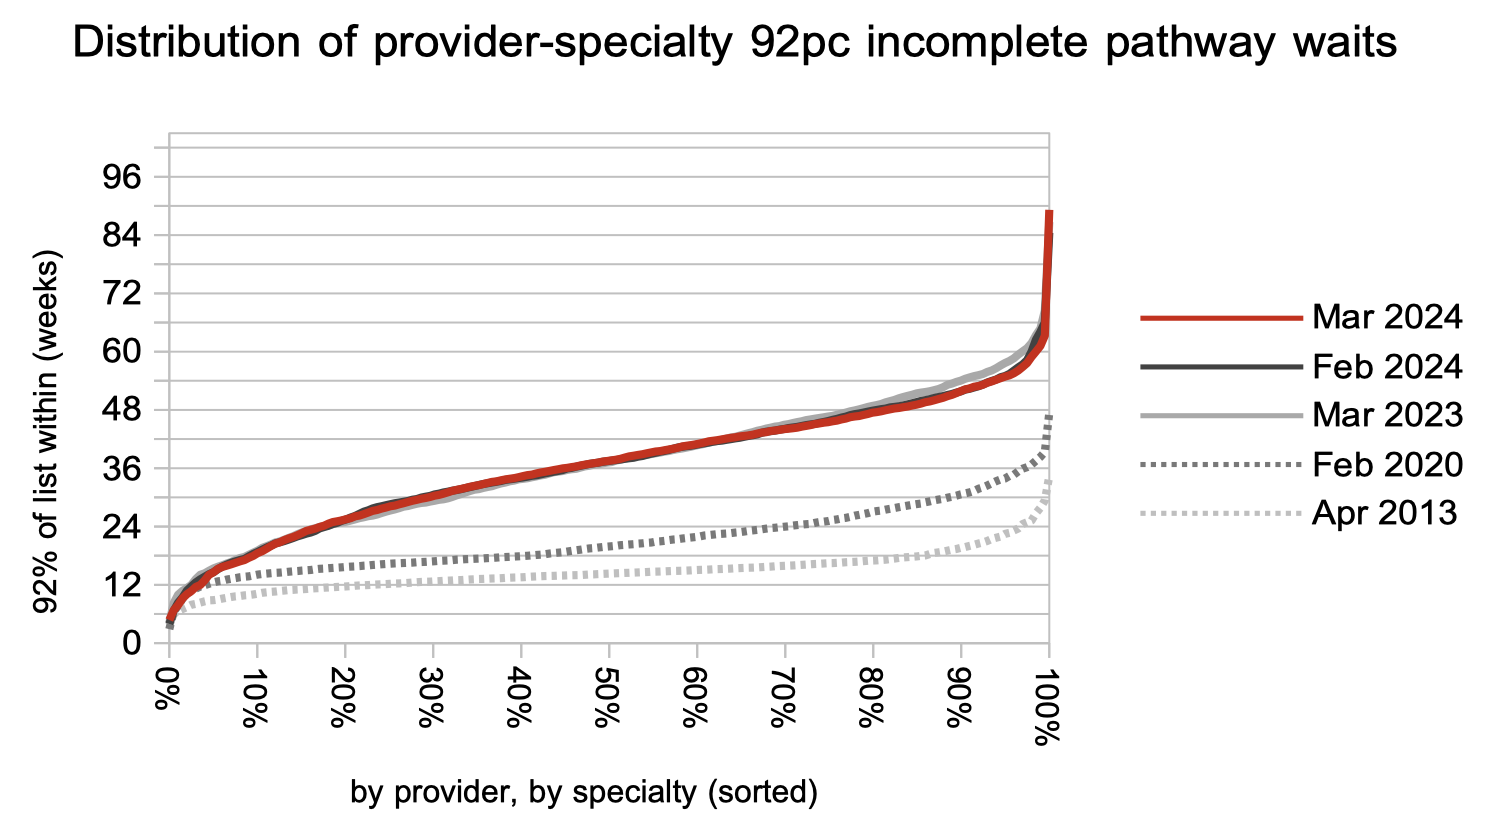
Over the last year, waiting times have fallen in the one-year region in response to the current targets to eliminate the longest waits. But as the rest of the distibution below shows, this has not affected the waiting time experience in most of the NHS.
Referral-to-treatment data up to the end of April is due out at 9:30am on Thursday 13th June. The work-in-progress WLMDS gives us an indication of what it will say: at least 162 patients still waiting over 104 weeks, 4,655 over 78 weeks, and overall a shrinking waiting list. In other words, the targets to eliminate the longest waiters are still being breached but things are looking up overall.