

We can estimate that over 20,000 of them have unsuspected cancer, and face a typical 10 month wait for that diagnosis.
Analysis produced for Health Service Journal by Dr Rob Findlay, Director of Strategic Solutions at Insource Ltd and founder of Gooroo Ltd
There were over 7 million patients on the English waiting list at the end of August, according to the latest referral-to-treatment (RTT) waiting list data. Waiting times rose again from 45.9 to 46.4 weeks RTT.
Of those 7 million patients waiting for treatment or discharge, some 6 million have not yet reached diagnosis and decision to admit. Remembering that the second most common route to a cancer diagnosis is an ordinary (non-cancer) GP referral, we can estimate that over 20,000 of them have cancer but do not yet know it, and they now face a typical waiting time of 43.3 weeks (10 months) since referral to find out.
This is the clinical safety case for reducing waiting times to diagnosis and decision first, before bringing down the typical wait for eventual treatment, so that nobody waits too long for their cancer to be diagnosed. Unfortunately the government are currently targeting the opposite approach by focusing on RTT long waits (more than three-quarters of two year waiters already have a decision to admit).
In the following discussion, all figures come from NHS England. If you have a national statistic that you’d like to check up on, you can download our waiting times fact checker.xls
The numbers
The trends established in May 2021 broadly continued, although there has been a modest improvement in the number of patients coming in for treatment.
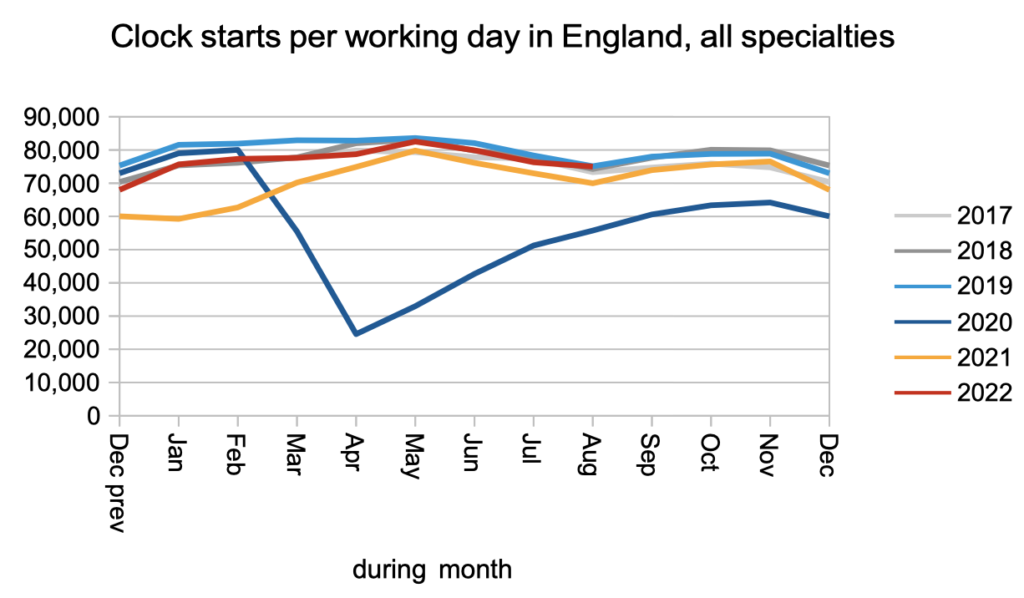
Demand was at close to pre-pandemic levels, as measured by the rate of patients starting new waiting time ‘clocks’.
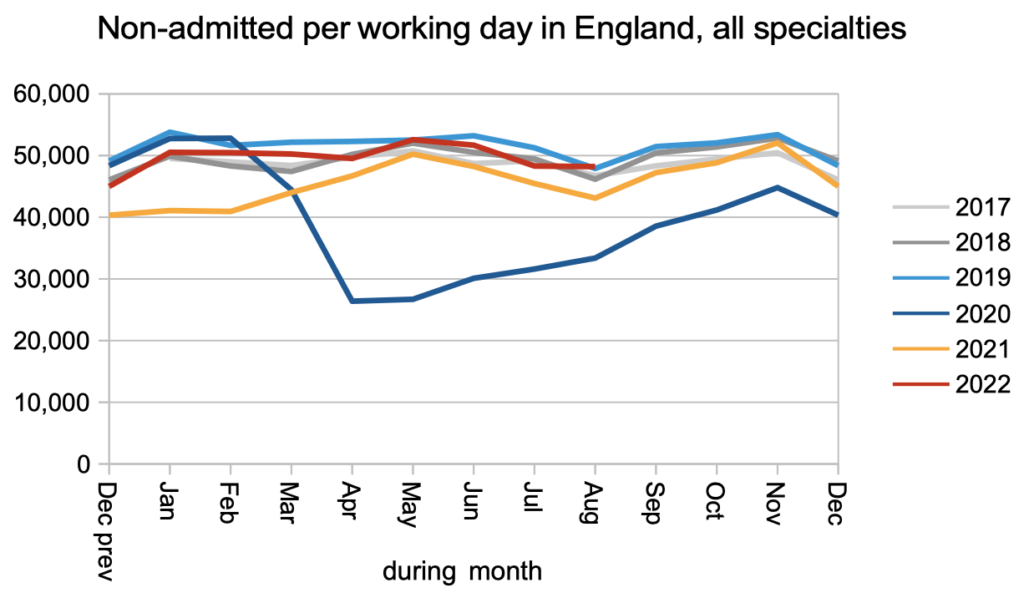
The rate that patients were treated or discharged in clinic (or administratively) also remained at roughly pre-pandemic levels. Actually it slightly exceeded those pre-pandemic rates for the first time, which is a useful milestone.
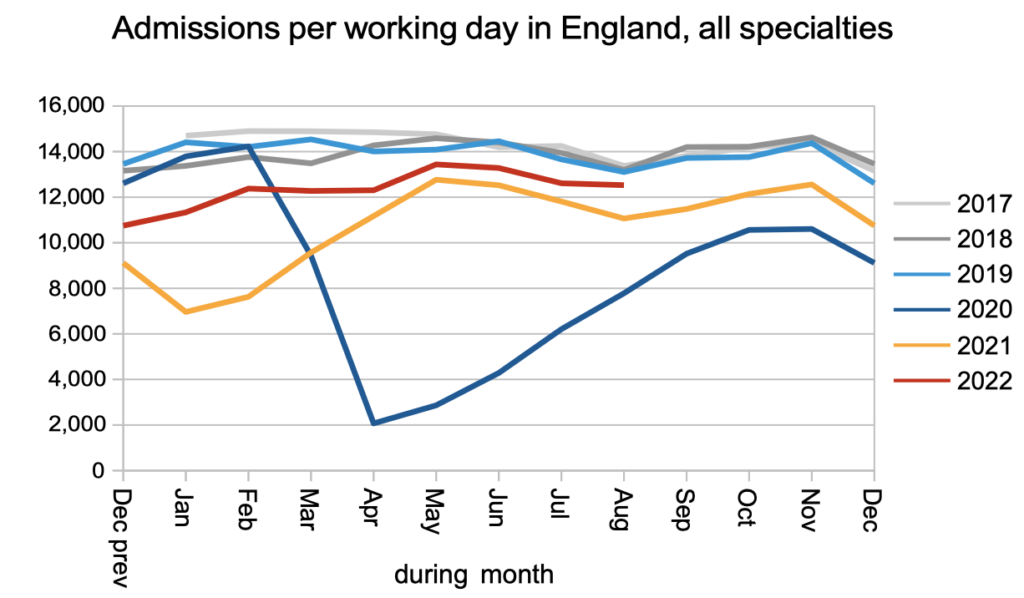
The rate that patients were admitted for treatment remained below pre-pandemic levels, although again the rate improved a little in August.
The net result of pre-pandemic demand and below-pandemic activity is that the waiting list grew, passing 7 million for the first time.
In the introduction I estimated there are now over 20,000 patients on the waiting list who have unsuspected cancer, and here I will explain how I arrived at that estimate. In 2017, there were 68,824 cancer diagnoses following an ordinary (not Two Week Wait cancer) referral, and 19,182,200 new RTT clock starts, so those cancer diagnoses were 0.36 per cent of new clock starts. These patients will feed through the waiting list until their cancer is detected through diagnosis. Assuming they reach diagnosis at the same rate as other patients (which is likely because their cancer is not yet suspected, otherwise they would have been referred on the Two Week Wait pathway), each cohort will contain a similar proportion of such patients, and therefore so will the entire pre-diagnosis waiting list. At the end of August 2022, our best proxy for pre-diagnosis patients is the waiting list without a decision to admit, and there were 5,939,226 such patients reported. So, the estimated number with undiagnosed cancer is 0.36 per cent of that which is 21,309, or ‘over 20,000’.
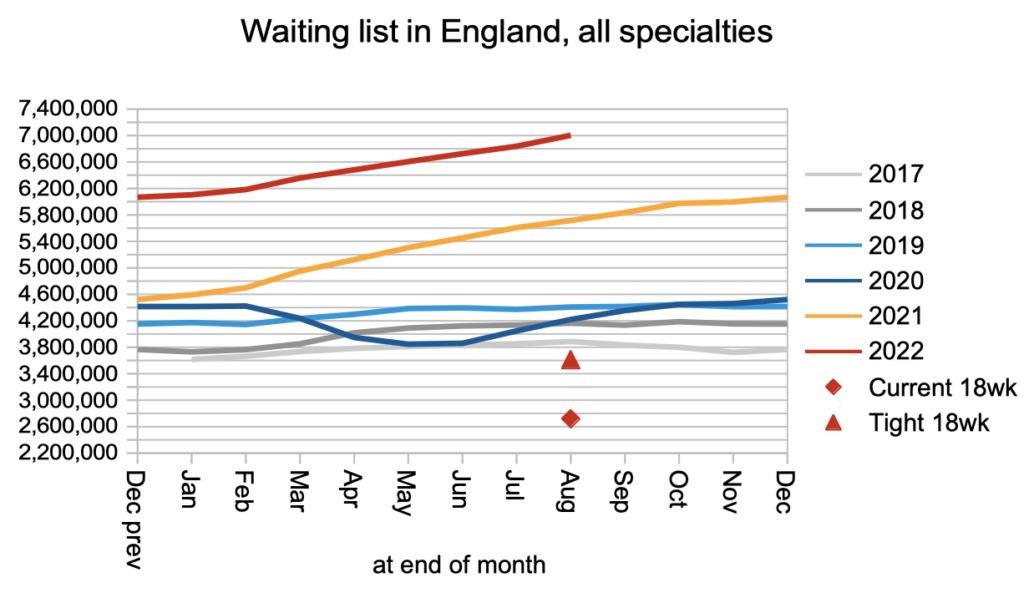
Waiting times also grew, reaching 46.4 weeks RTT, and 43.3 weeks from referral to diagnosis and decision to admit (both measured as the waiting time within which 92 per cent of the waiting list lies, which is a reasonable measure of the typical wait for a non-urgent patient). But don’t subtract one from the other to estimate the waiting time from decision to treatment – it doesn’t work like that because patients reach decision to admit with varied waiting times.
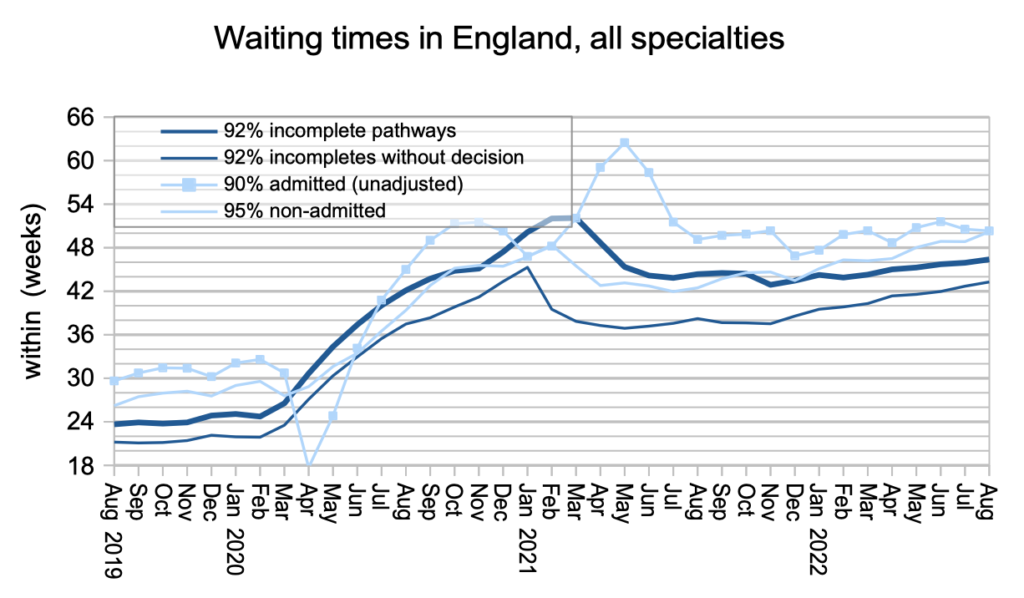
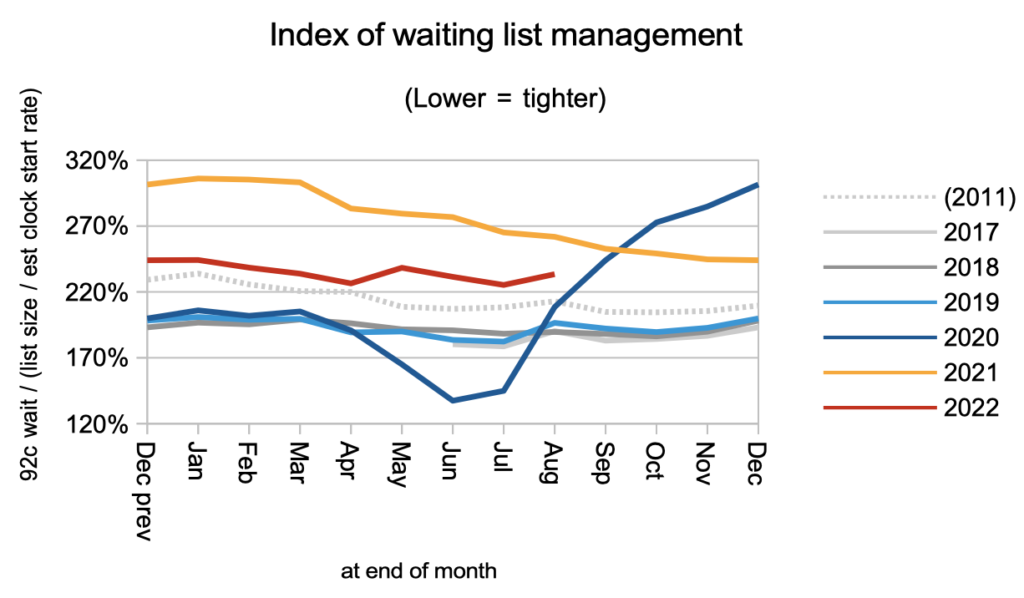
Waiting times depend on both the size and shape of the waiting list, and the next chart is a measure of the shape. It remains significantly worse than pre-pandemic, mainly because of the greater variation in waiting times around the country.
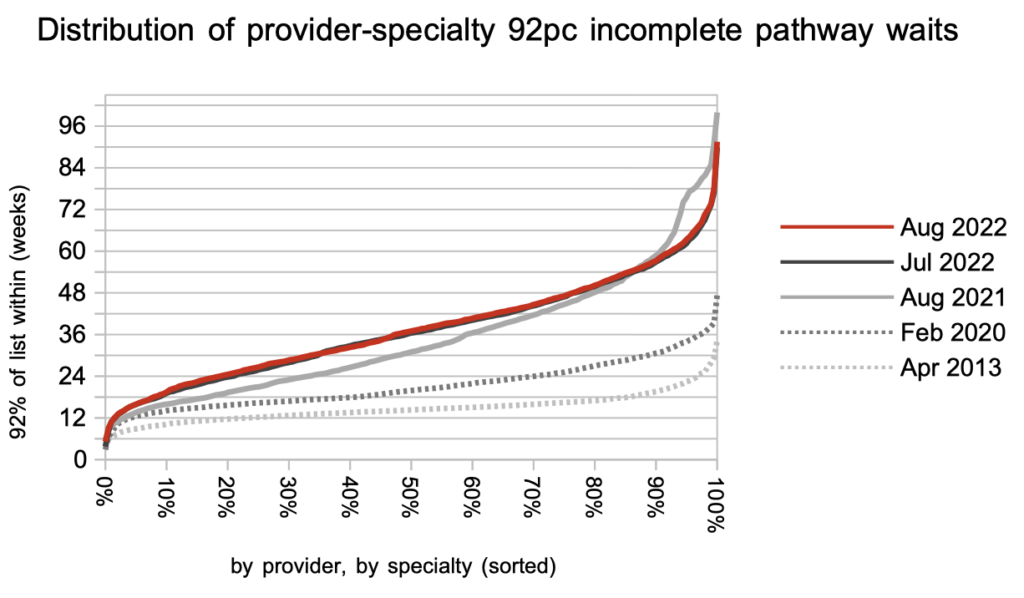
Waiting times at specialty level varied in August but most showed a modest increase that reflects the overall picture.
The increase in waiting times was seen across the board.
Referral-to-treatment data up to the end of September is due out at 9:30am on Thursday 10th November. See 12 months statistics calendar.