

The English waiting list has passed its seasonal summer peak, and the size of the list is coming back down again. The national waiting list initiative, aimed at treating the longest-waiting patients, is at last having a noticeable effect and at the end of September there were fewer long-waiters remaining on the waiting list.
To be perfectly honest this is much better news than I was expecting. Quite why it is so good, however, remains something of a mystery.
Admissions per working day were no higher this September than last, although more long-waiters were admitted. Non-admitted activity was up a bit, but not enough to explain the drop in the waiting list. So there must be something going on around referrals, the acceptance of referrals, or waiting list validation to explain the fall.
The national focus on treating long-waiting patients is paying dividends, with the largest improvements now being seen in the longest-waiting services as intended. All measures of long-waiters on the waiting list have improved, with Orthopaedics (which is a particular focus of the national waiting list initiative) improving particularly sharply in September and achieving the incomplete pathways target for the first time in nearly a year.
But a big test for policy-makers is fast approaching.
The amnesty on the perverse ‘adjusted admitted’ and ‘non-admitted’ targets is due to expire at the end of November. Will they brave the headlines and do the right thing, by extending the amnesty indefinitely so that hospitals can continue to treat all their long-waiting patients without restriction? Or will they go back to enforcing these perverse targets, requiring hospitals to admit 9 short-waiters for every long-waiter, and effectively leaving many patients stranded once they tip over the 18 week mark?
Extending the amnesty is the right thing to do from a patient care point of view (as the Secretary of State so eloquently explained on the 4th of August), and it also minimises the risk of breaching the more-important incomplete pathways target before the General Election. If that target were breached nationally, then the Coalition really would have broken the 18 week promise.
In the following analysis, all figures come from NHS England. If you have a national statistic that you’d like to check up on, you can download our Gooroo NHS waiting times fact checker
England-wide picture
More Trusts dropped out of the data in September, including Barts who had briefly reappeared in August, and Walsall who reckon their August data wasn’t right after all. The current list is:
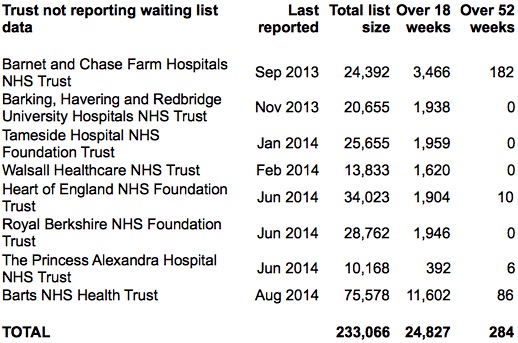
Non-reporting Trusts
These missing Trusts are excluded from the chart below, and if you add them back in then the total waiting list size comes to 3,224,303.

Total size of waiting list
Admissions per working day were ever so slightly lower than last year, which is disappointing given that NHS England chucked a quarter of a billion pounds into the kitty to pay for lots of extra waiting list treatments over the summer.
Admissions of long-waiting patients were up, however, thanks to the sensible decision to stop enforcing the perverse admitted and non-admitted targets and encourage hospitals to treat their longest-waiting patients. This caused ‘adjusted admitted’ performance to remain below the 90 per cent target, at 88.3 per cent, as part of the ‘managed breach’ that is currently due to expire at the end of November.
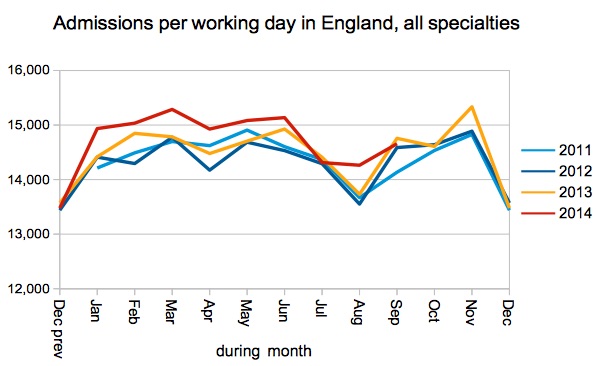
Admissions per working day
As the total waiting list got smaller, so the number of long-waiters fell sharply too. It is difficult to place too much reliance on these trends because so many Trusts are not reporting their waiting list data, but it looks like good news. The stubborn core of one-year-waiters, it seems, is in spinal surgery where there is a national shortage of capacity.

Long waiters on the list
Performance on my favourite measure – how long 92 per cent of the waiting list has waited – improved in line with the other indicators, and turned around just the right side of the 18 week mark.

92pc of waiting list within
The improvement was seen in all specialties, with particularly dramatic gains in Orthopaedics which achieved the incomplete pathways target nationally for the first time since last year. This specialty was a particular focus of the national waiting list initiative (and the only specialty for which separate reporting was required) and it is good to see that the effort bore fruit.
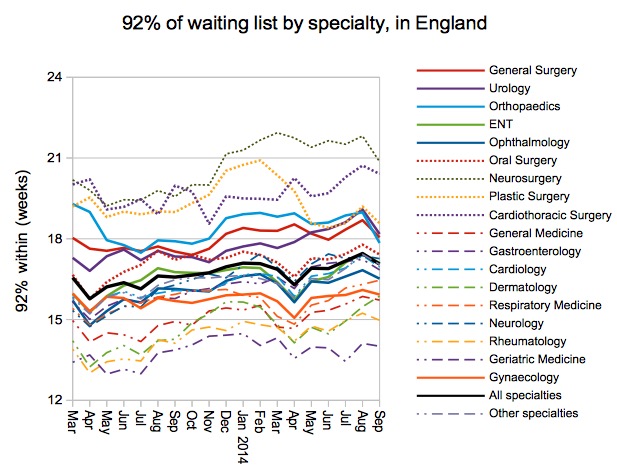
92pc of waiting list by specialty
The incomplete pathways target is meant to be achieved in every specialty in every Trust, and a few more specialties started achieving the target during September.
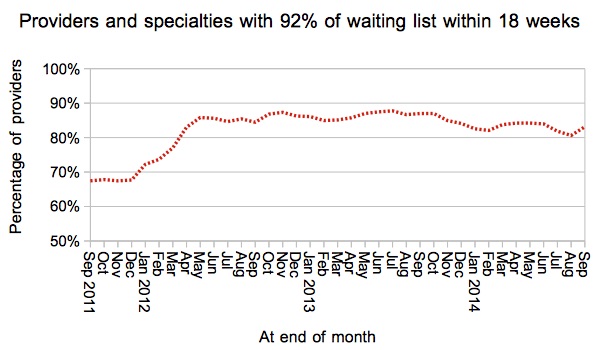
Provider-specialties achieving 92pc target
In a well-targeted waiting list initiative you would expect those services with the longest waits (at Trust specialty level) to improve the most. For the first time since the national waiting list initiative began, this actually happened.
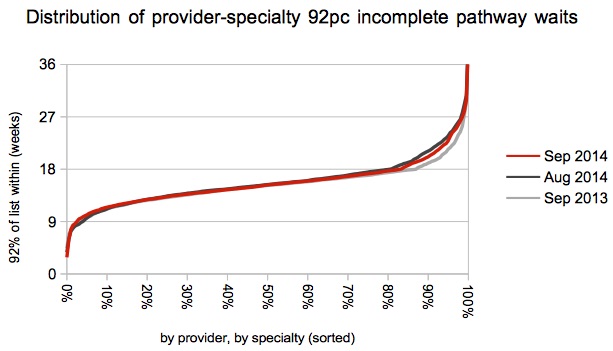
Distribution of 92pc waits by provider-specialty
Local detail
There are interactive maps showing the all-specialties position at every Trust and CCG. For specialty-level analysis at a particular Trust, independent sector provider or CCG, visit our 18-weeks reports page.
There is also a map showing where apparently perverse waiting list management has been detected according to the following test: the adjusted admitted and non-admitted targets were both achieved during the month, even though the incomplete pathways target was breached at both the start and end of the month.
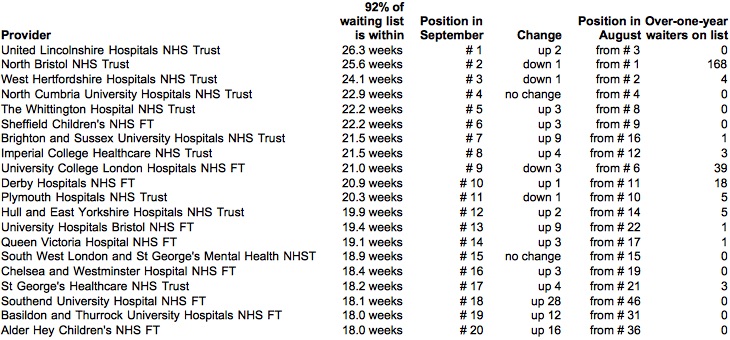
Lincolnshire have jumped to the top of the table, edging North Bristol (who have the largest number of one-year waiters, nearly all in Orthopaedics) down to second place.
Top twenty
Congratulations to Weston for dropping all the way from 5th to 157th in the table, by shortening their 92 per cent incomplete waits from 22.6 to 14.4 weeks. Well done also to North Middlesex (21.8 to 16.9 weeks), Oxford (20.5 to 18.0), Mid Yorkshire (19.4 to 17.9), and Blackpool (18.9 to 17.4).
Data for October 2014 is due out at 9:30am on Thursday 11 December 2014.