

Two-year waits may be falling, but the underlying pressure on waiting times continues to grow
Analysis produced for Health Service Journal by Dr Rob Findlay, Director of Strategic Solutions at Insource Ltd and founder of Gooroo Ltd
The financial year 2021-22 ended as it started, with a rapidly growing elective waiting list, fuelled since last May by near pre-pandemic demand and below pre-pandemic admission rates. This means that the underlying pressures on waiting times continued to grow.
This deterioration will carry on until something changes, which it actually might, because April saw the relaxation of infection control measures that should reduce the difficulty of physically admitting patients to hospital for treatment.
As the new financial year begins, all eyes are on the new targets to eliminate 104 week waiters and then 78 week waiters by delivering more elective activity than before the pandemic.
The traditional approach to such targets is very direct: draw up a list of those patients who are set to breach the target, and then try to book them in before they do. This works when the numbers are small, and the target is achievable, but runs into trouble when things get more difficult, and the targets ratchet down. Continuous processes that address the root causes of long waits would deliver more sustainable results than the traditional approach of managing in batches and at the margins.
In the following discussion, all figures come from NHS England. If you have a national statistic that you’d like to check up on, you can download our waiting times fact checker.xls.
The numbers
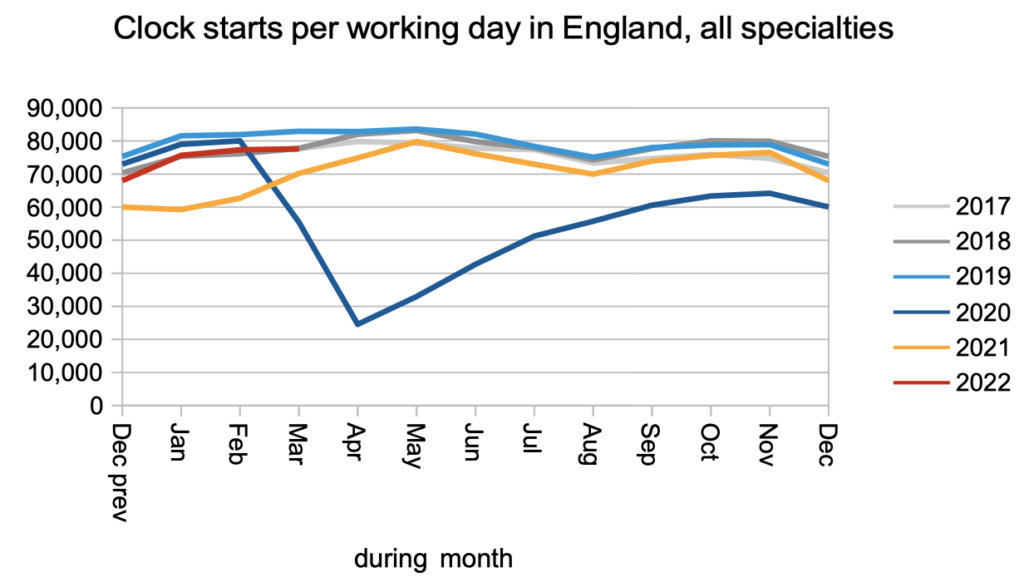
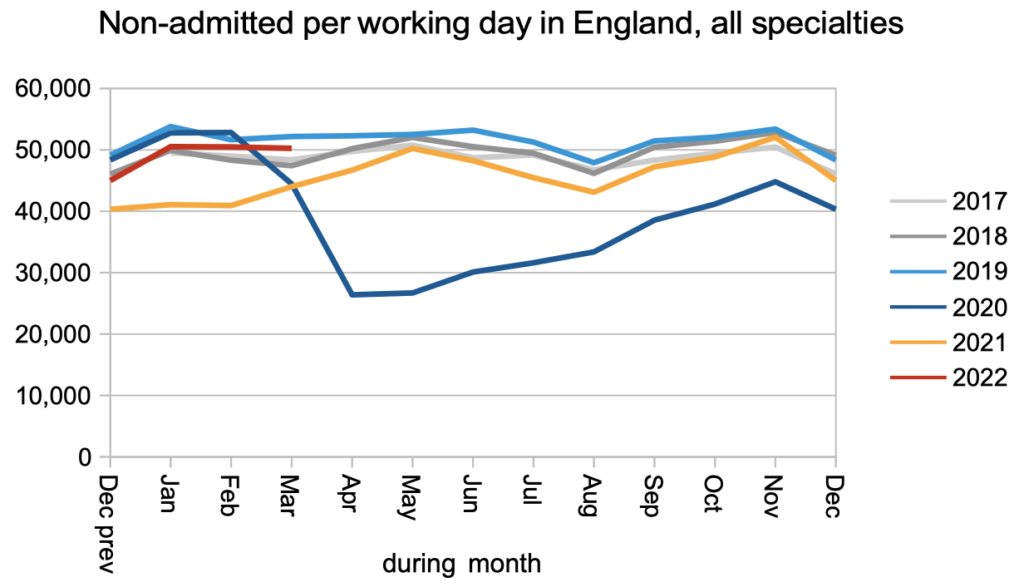
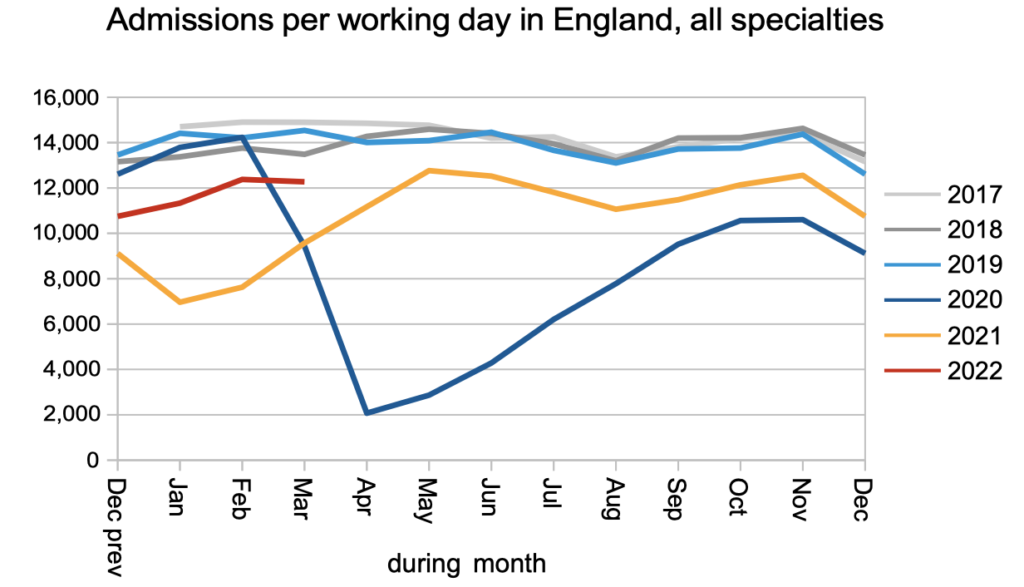
The first few charts show a continuation of the pattern established in May 2021, with clock starts (new patients arriving on the referral-to-treatment waiting list) running at near pre-pandemic levels, non-admitted clock stops (mostly patients discharged from outpatient clinics) also at near pre-pandemic levels, and admissions for treatment well below pre-pandemic.
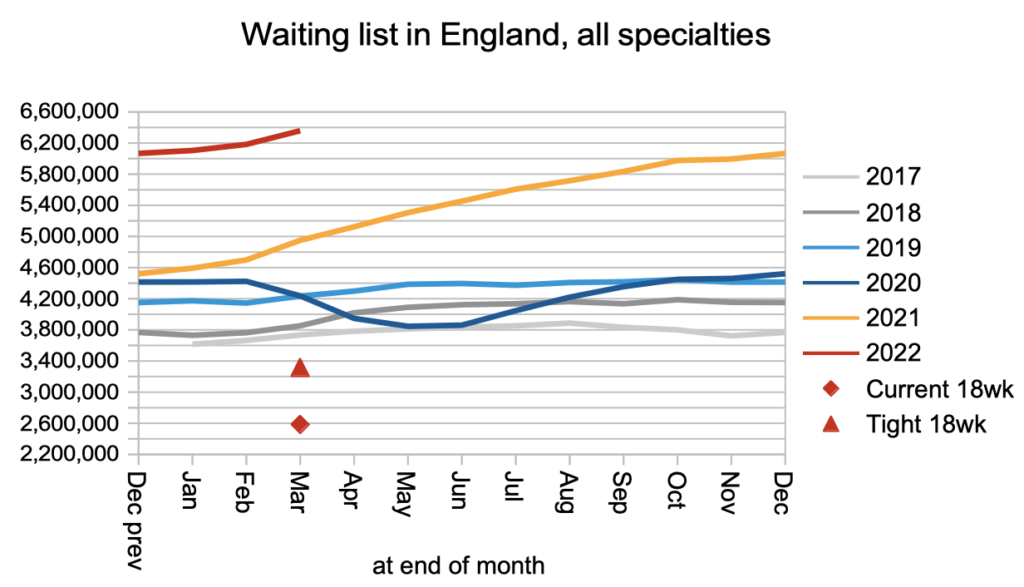
The net result of near pre-pandemic demand and below pre-pandemic activity is a growing waiting list, especially when we remember that the waiting list was growing year-on-year even before the pandemic. A growing waiting list is one of the root causes of long waiting times.
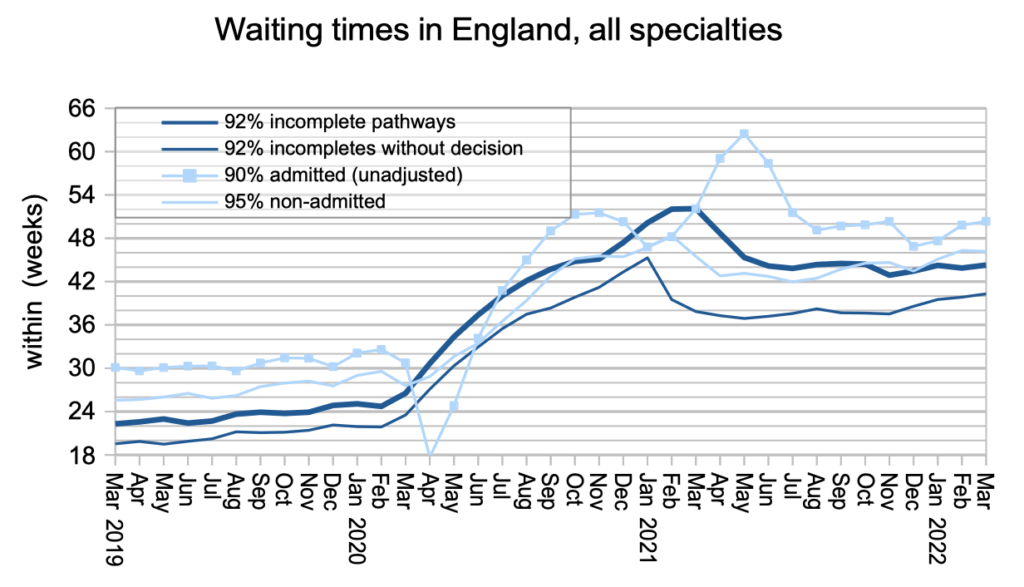
Waiting times from referral to treatment (RTT) rose very slightly. Within that pathway, waits from referral to diagnosis and decision increased again, which is a concern because some patients who are waiting a long time for diagnosis have urgent conditions such as cancer that have not yet been detected. To tackle this risk, the Welsh Government suggest splitting the RTT target so that waiting times to diagnosis and decision can be reduced first, and it would be good if England were to follow their lead – see our blog – RTT waiting times have reach the end of the road.
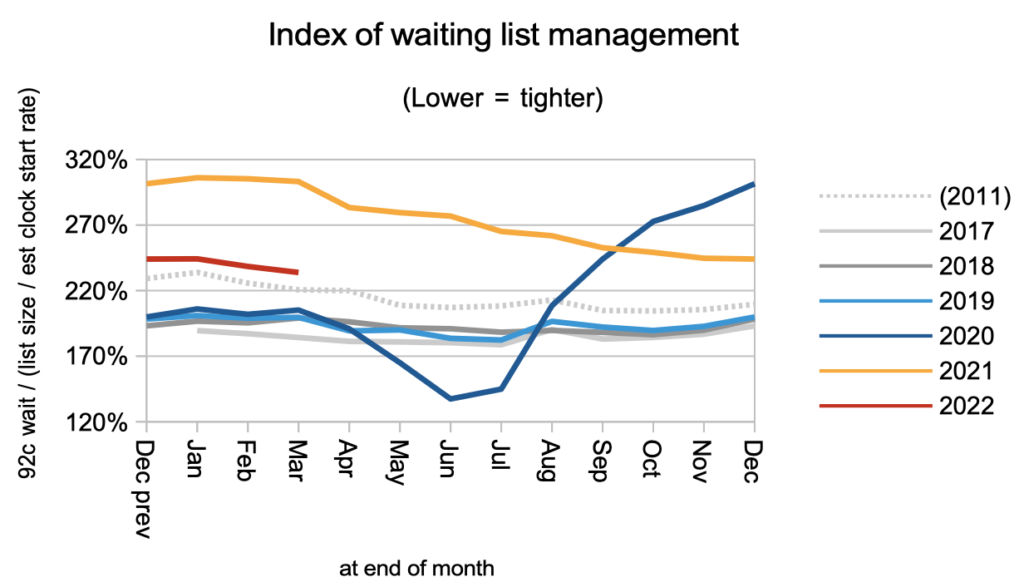
The other root cause of long waits is the order in which patients are booked for care, which at national level is also driven by unequal waiting times between specialties and providers. The next chart summarises the trend across England. This has improved since the depths of the pandemic but remains significantly worse than the pre-pandemic years.
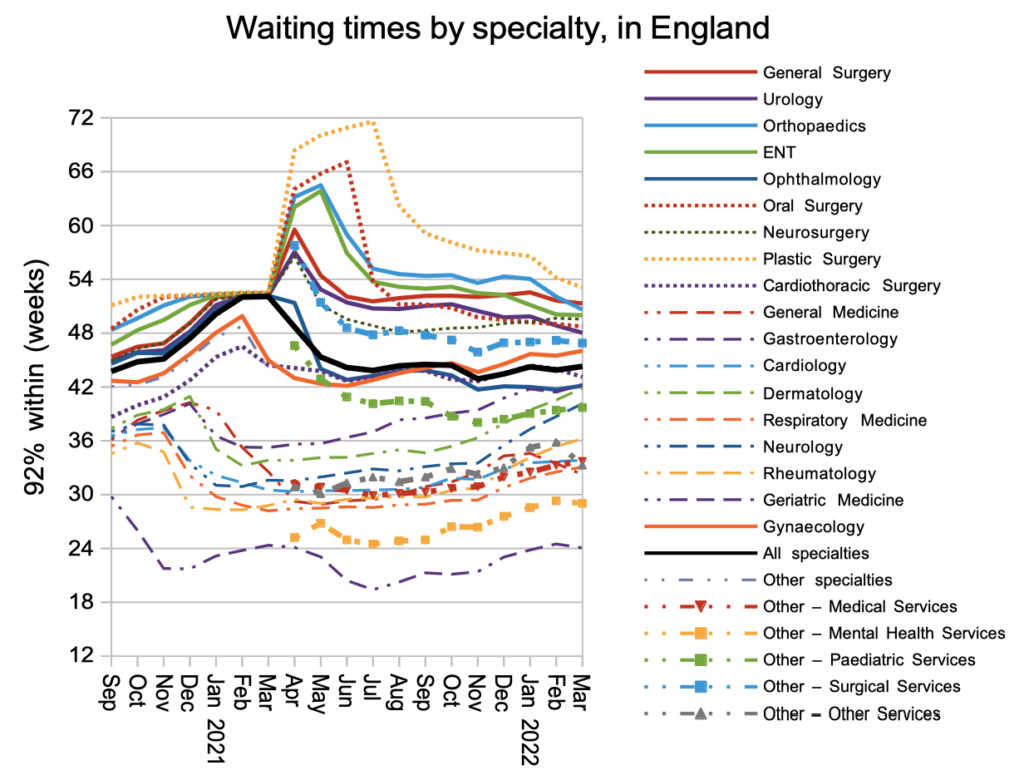
Waiting times in the long-waiting surgical specialties mostly improved, as other specialties slightly deteriorated.
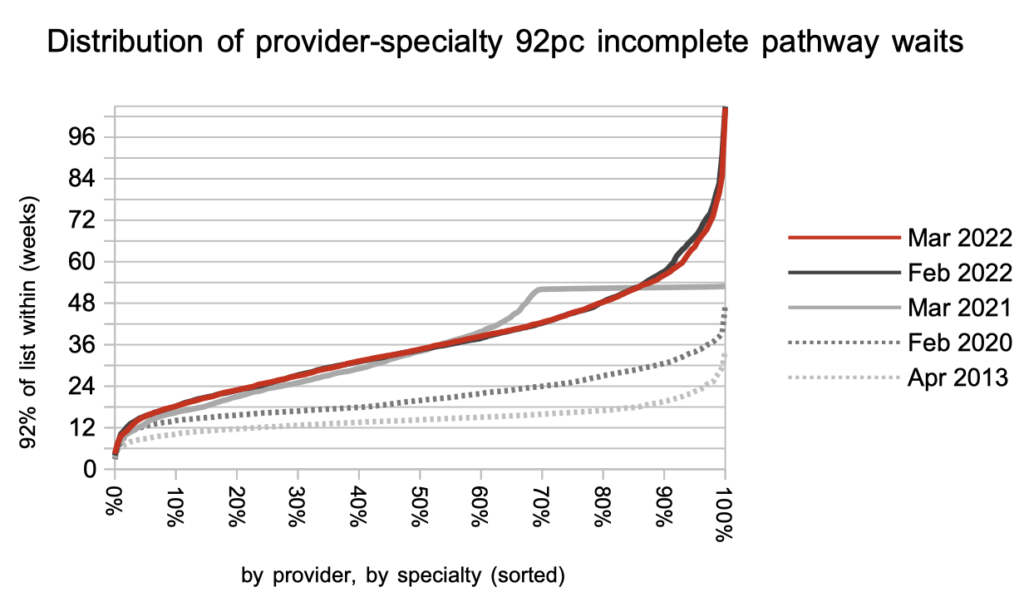
Overall the distribution of local waiting times around England was little changed on the previous month. When looking at the 2021 line, remember that the waiting times data only went up to 52 weeks in those days.
Referral-to-treatment data up to the end of April [NHSE calendar] is due out at 9:30am on Thursday 16th June 2022 which, unusually, is the third Thursday of the month and not the second.