

You can’t plan a covid recovery on a purely RTT basis. Not usefully, anyway. Pure RTT data, which counts clock starts (referrals), clock stops (treatments and discharges) and incomplete pathways (anywhere in between), does not reveal how much of the problem needs to be handled in clinics, and how much will require bed and theatre capacity.
Fortunately, however, the RTT data that is published every month by NHS England is a bit more informative than that. It contains additional detail about how many patients have a decision to admit, and (by implication) how many do not.
Can we turn this published data into useful covid recovery plans? With a few assumptions, I think we can, by splitting the data into two stages: from referral to decision, and from decision to treatment.
This is useful for two reasons. Firstly, it splits our planning into outpatient and diagnostic capacity on the one hand, and inpatient and daycase capacity on the other, to give us some idea about the kinds of capacity we are going to need. Secondly, it allows us (if we want) to tackle referral to decision waiting times first, and end the very long waits being suffered by patients with unsuspected cancers and other urgent conditions.
The RTT pathway
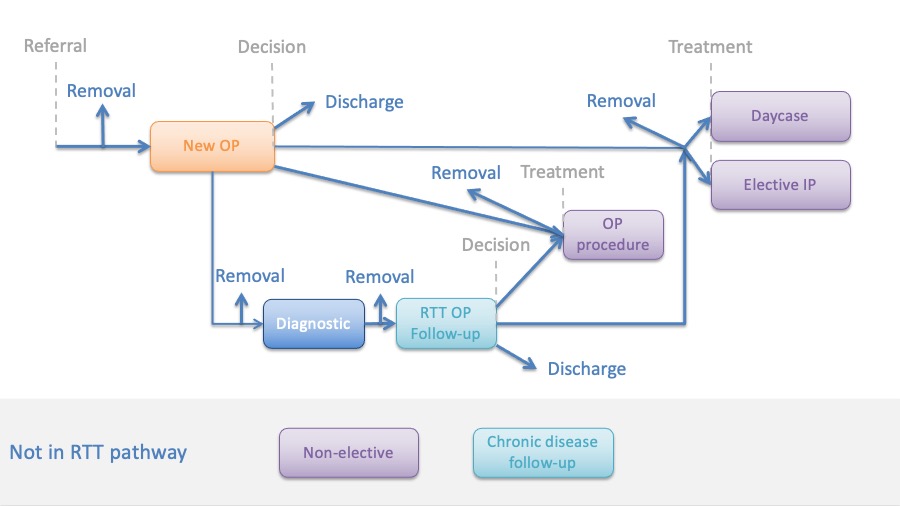
The diagram below outlines a typical surgical RTT pathway.
The waiting time ‘clock’ starts ticking when the patient is referred to a consultant-led service. After a period of waiting (during which some patients may be removed from the waiting list for various reasons), the patient has their first outpatient (OP) appointment.
One of three things might happen at that appointment: a decision to be treated (in which case the patient is added to a waiting list for inpatient, daycase or outpatient treatment); a decision not to be treated (in which case the patient is discharged); or the patient might be referred for further diagnostic testing before making any decision.
The RTT waiting time ‘clock’ only stops ticking when the patient is treated or discharged (or otherwise removed).
That diagram is a bit complicated, but fortunately we can simplify it if we change one thing.
Simplified pathway
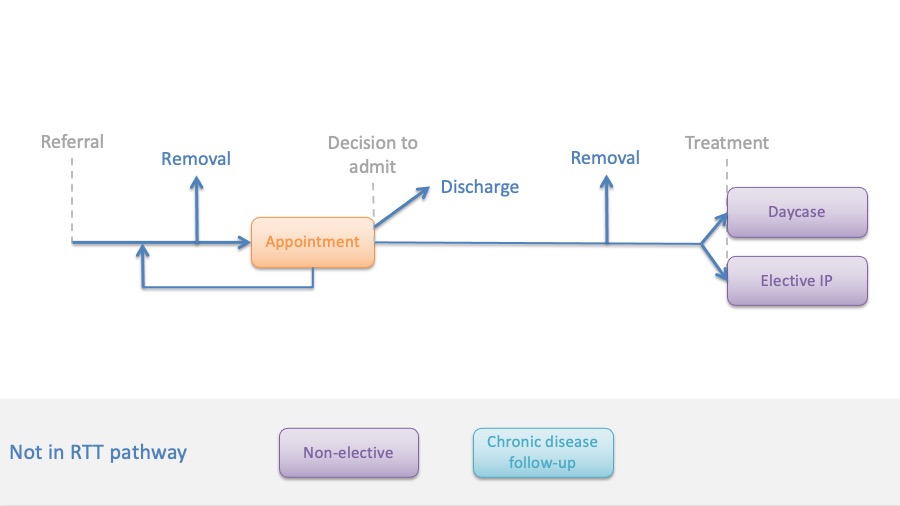
In the diagram above, “Decision” means “decision to be treated”, which includes outpatient procedures. However the published RTT data does not identify patients with a decision to treat; instead it identifies patients with a decision to admit, which excludes outpatient procedures.
If we use decision to admit instead, then we can simplify the diagram like this:
Now we can use this simplified diagram to compare the published RTT data, with the data we need to plan the covid recovery.
The RTT data available
In the next diagram, the top half shows the published RTT data, and the bottom half shows the data we need to plan the covid recovery.
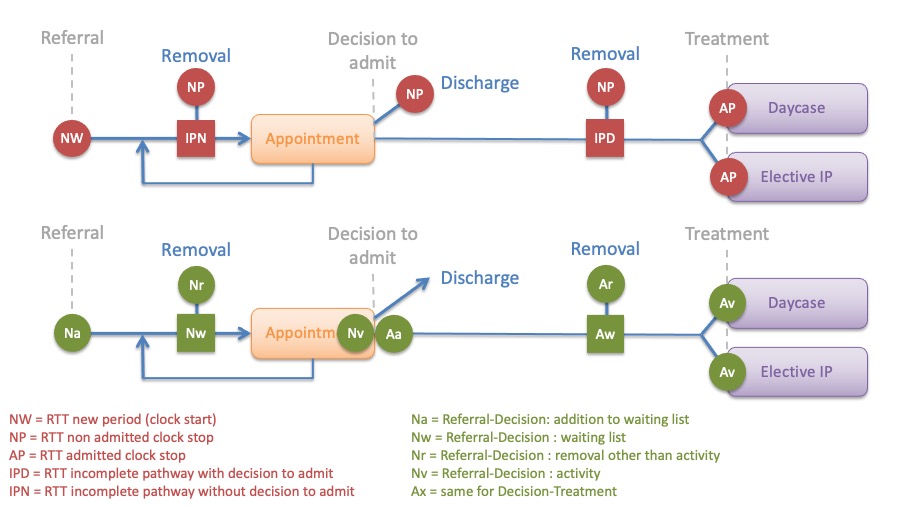
We can immediately see that there are some overlaps.
The number of new RTT clock starts (NW) is equal to the number of additions to the Referral-Decision waiting list (Na). Similarly the numbers of incomplete pathways on each side (IPN and IPD), are equal to the sizes of the waiting lists we need (Nw and Aw). And the number of admitted clock stops (AP) is equal to the Decision-Treatment activity (Av).
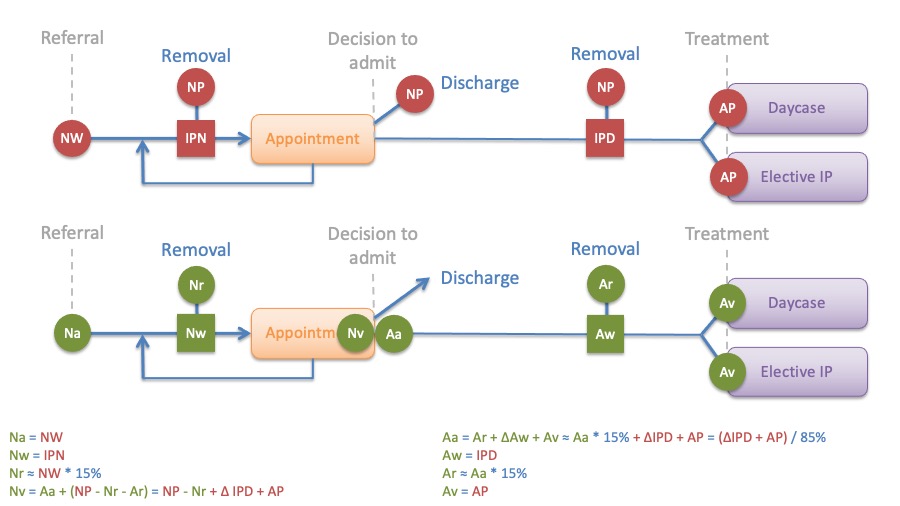
To get the rest of the numbers, we need to make an assumption about how many patients are removed from these waiting lists. In real life this varies from one service to another, but we don’t have that data here. So let’s make a blanket assumption that 15 per cent of patients added to a waiting list are removed from it, before reaching a decision to admit in the case of the Referral-Decision list, and before reaching treatment in the case of the Decision-Treatment list. That gives us the two removal figures (Nr and Ar).
Now we can estimate the number of patients being added to the Decision-Treatment waiting list by tracking where they end up (it’s the number removed, plus the growth in waiting list, plus the number treated). And finally we can estimate the number of patients who end their Referral-Decision stage with an appointment, which is the number added to the Decision-Treatment stage, plus the number discharged at that point (which is those non-admitted clock stops not accounted for elsewhere).
The equations are shows in the diagram below.
Using the data
We are now nearly ready to transform the published RTT data into a dataset for uploading into Gooroo Planner, so that we can plan the covid recovery.
The diagram above shows how we can obtain the required historical data for a pre-covid period such as 2019: activity, additions, waiting list sizes (at the start and end of 2019, plus the most recent snapshot), and removals.
The pent-up demand from patients who have avoided the NHS during covid can be estimated as a proportion of the missing clock starts each month, by comparing each month after March 2020 with the corresponding month in 2019. For instance, we can continue our assumption that 15 per cent are removed without being seen or treated, and that perhaps a further 20 per cent will not return. Nobody knows how many of the missing referrals will come back, so we are making guesses here which might be wrong.
We need to estimate the proportion of urgent patients for the waiting time calculations. The RTT data does not reveal this, so we need to estimate it from the proportions currently being treated quickly. This is a fairly rough measure and is vulnerable to the distortions of covid, but it is already in use in our regular RTT analysis where it is a reasonable fit for the data.
Finally, demand seasonality comes from clock starts (for Referral-Decision), and non-admitted clock stops (for Decision-Treatment). Activity seasonality comes from non-admitted and admitted clock stops respectively.
Issues encountered
Some services had incomplete data for 2019, or missing recent waiting list snapshots, and these services were excluded.
Trusts that merged after December 2018 will also give strange results, including negative ‘extra pent-up’ demand, but these are left in the data as there is no simple way to separate them from services where demand has genuinely been greater since 2019.
Sustainable waiting times are based, in part, on the rate that patients are added to the waiting list. For the Decison-Treatment stage, those additions depend on activity at the Referral-Decision stage, so when Referral-Decision activity changes abruptly between models there is a discontinuity in the calculated sustainable waiting time (changes in Referral-Decison activity within a single model would be smoothed). We can see this discontinuity at the start of October 2021, when we switch from a restricted activity model of 85 per cent of pre-covid activity, to a full-blown recovery model; also at the start of April 2025 when the Referral-Decision recovery ends.