

The deterioration in the English waiting list continued during July, according to the latest referral-to-treatment (RTT) data.
Analysis produced for Health Service Journal by Dr Rob Findlay, Director of Strategic Solutions at Insource Ltd and founder of Gooroo Ltd
The list grew by just over 100,000 patient pathways, which is also the average growth per month for the previous three years. The Prime Minister has, of course, pledged that “NHS waiting lists will fall” so things are still going rapidly in the wrong direction. As Sarah Scobie at the Nuffield Trust has elegantly shown, the growing waiting list cannot be explained away by the ongoing strikes.
Within the 7.7 million are an estimated 27,866 patients whose eventual diagnosis will be a hitherto unsuspected cancer, and they will typically wait 43.6 weeks for that diagnosis. This is far too long. Either they will reach that diagnosis with more advanced disease, or they will notice the deterioration in their symptoms and seek re-referral on a suspected cancer pathway. Either way, this is a clinical risk to those patients. The only solution to this problem is to reduce the waiting time to diagnosis and decision for all patients.
In the following discussion, all figures come from NHS England. You can also look up your trust and its prospects for eliminating 65 week waits here.
The numbers
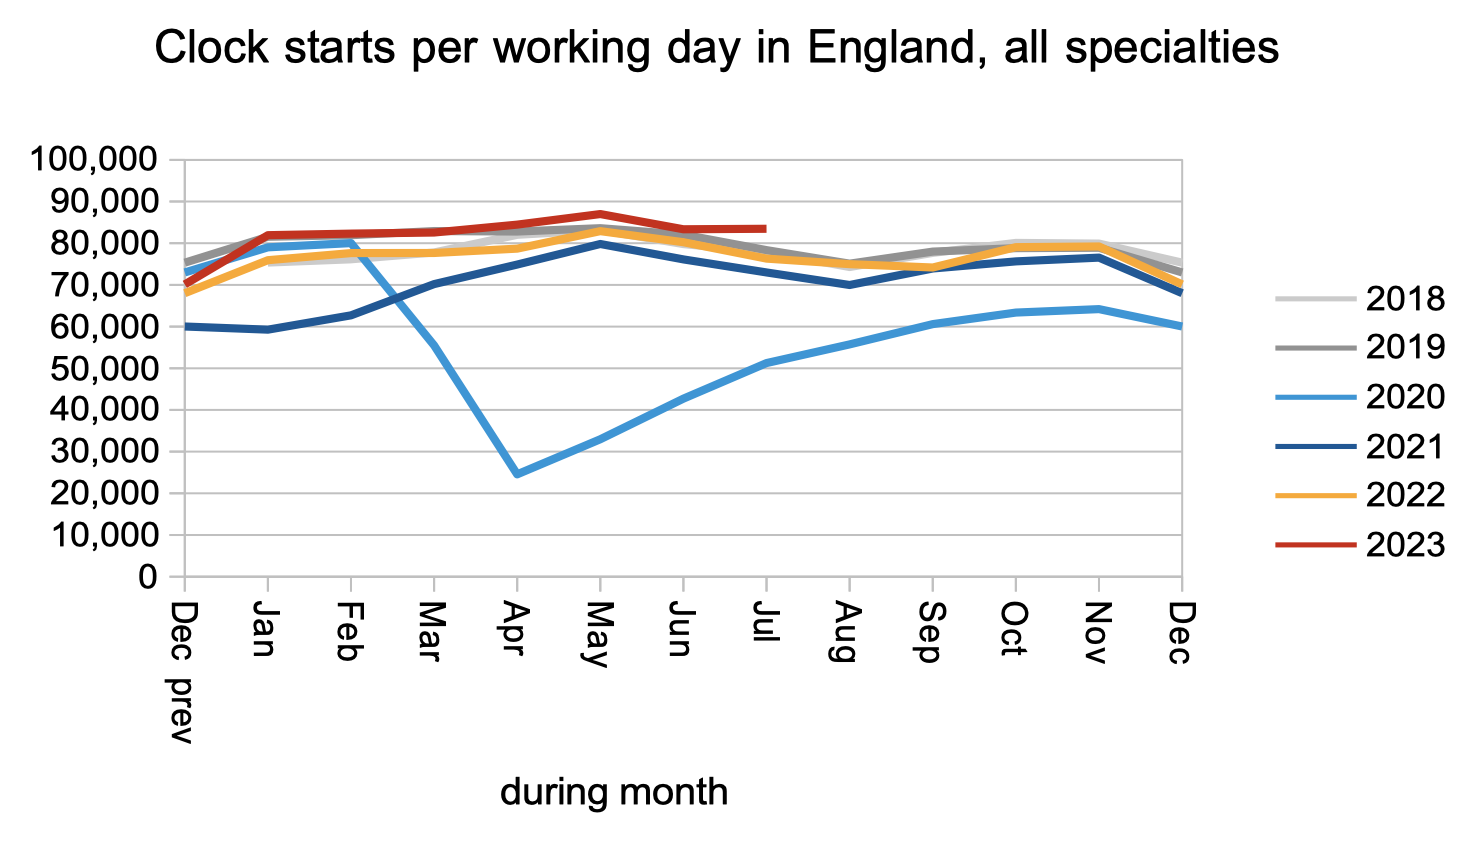
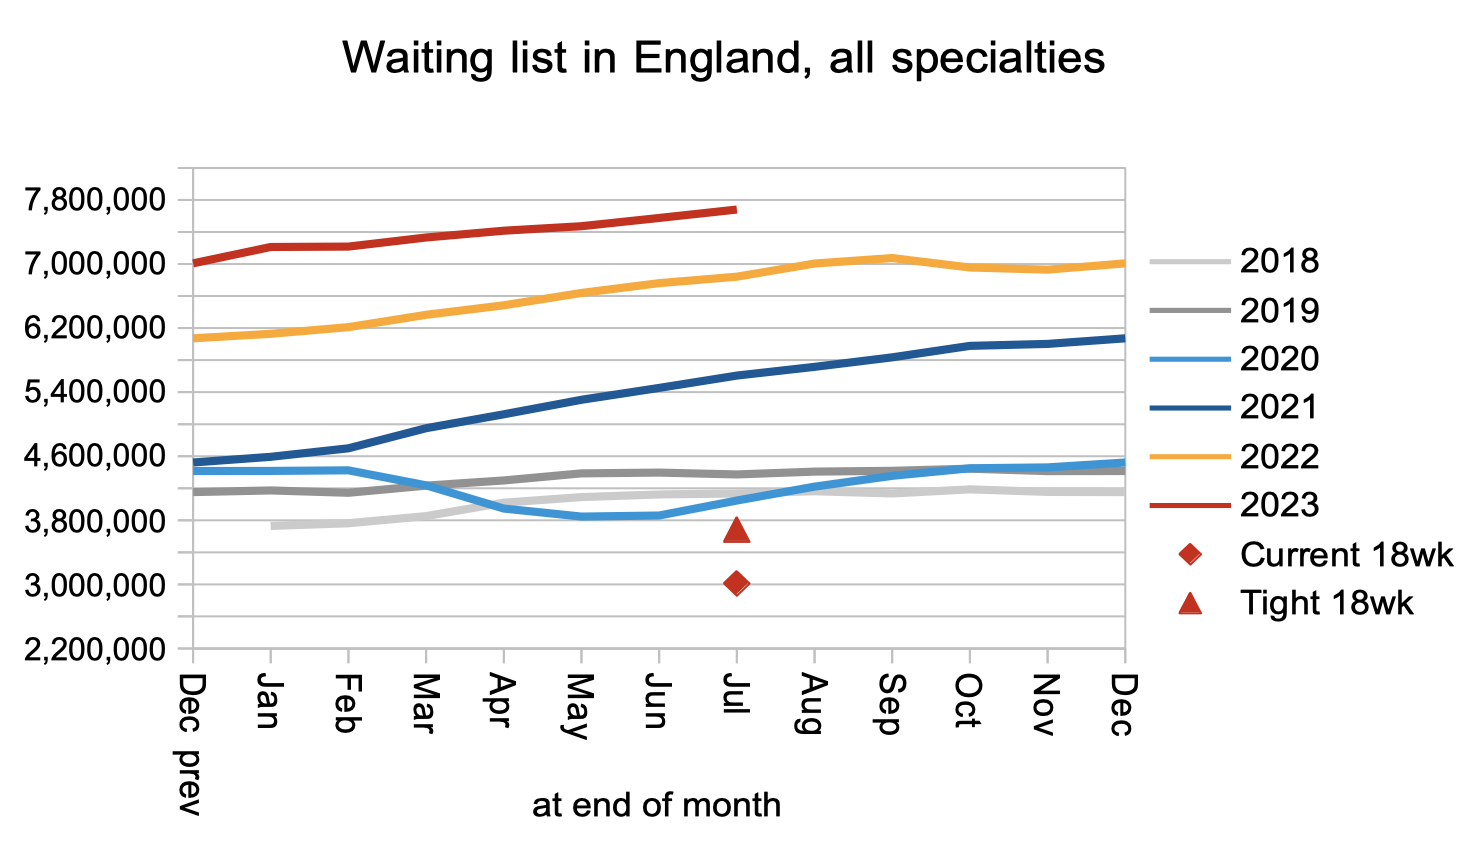
Patients were added to the waiting list to start new waiting time ‘clocks’ at a slightly higher than pre-pandemic rate during July.
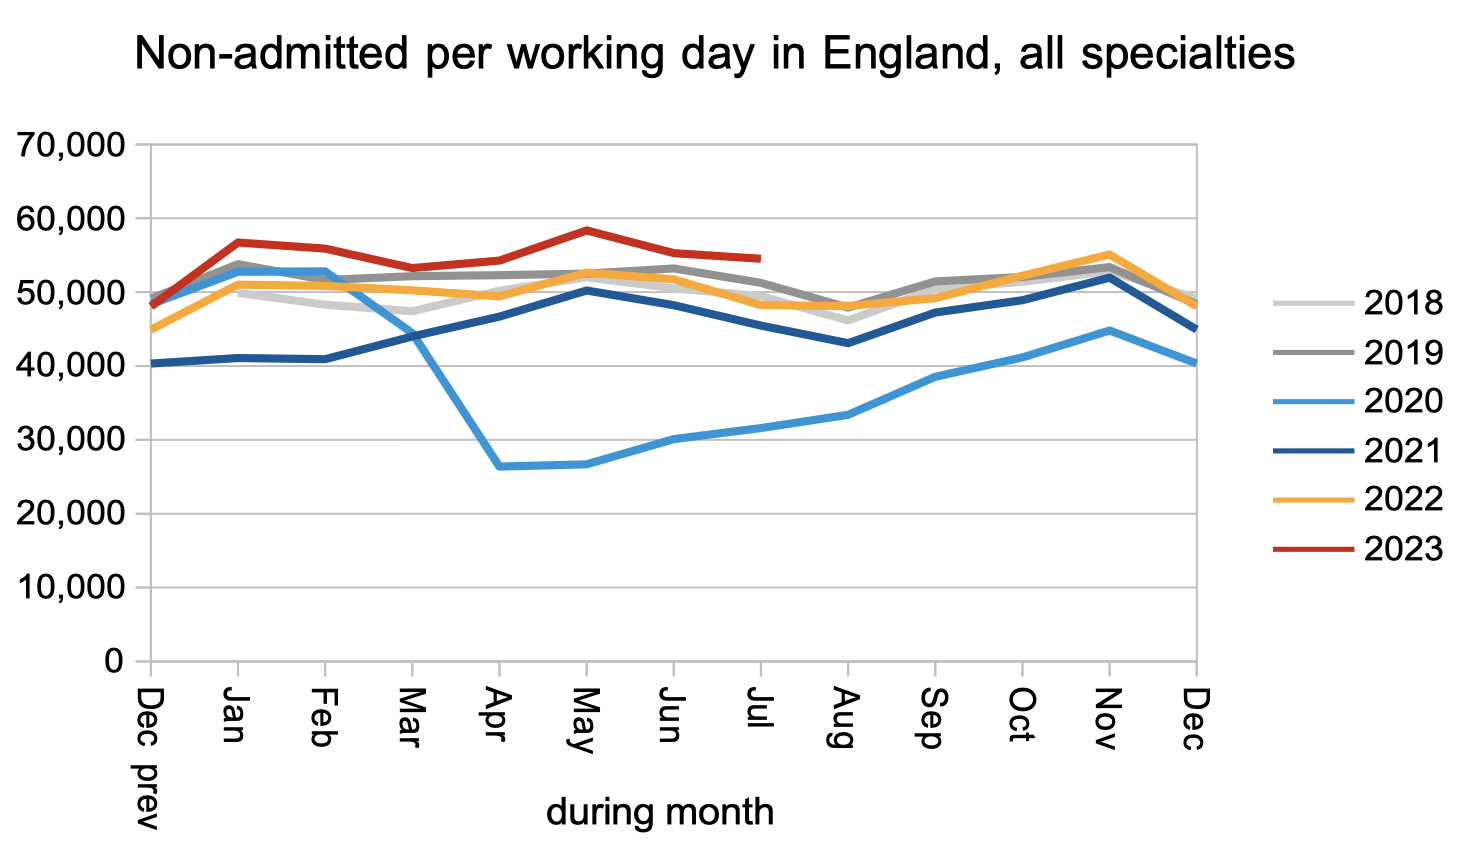
Patients were also discharged from clinic (or administratively) at slightly higher than pre-pandemic rates.
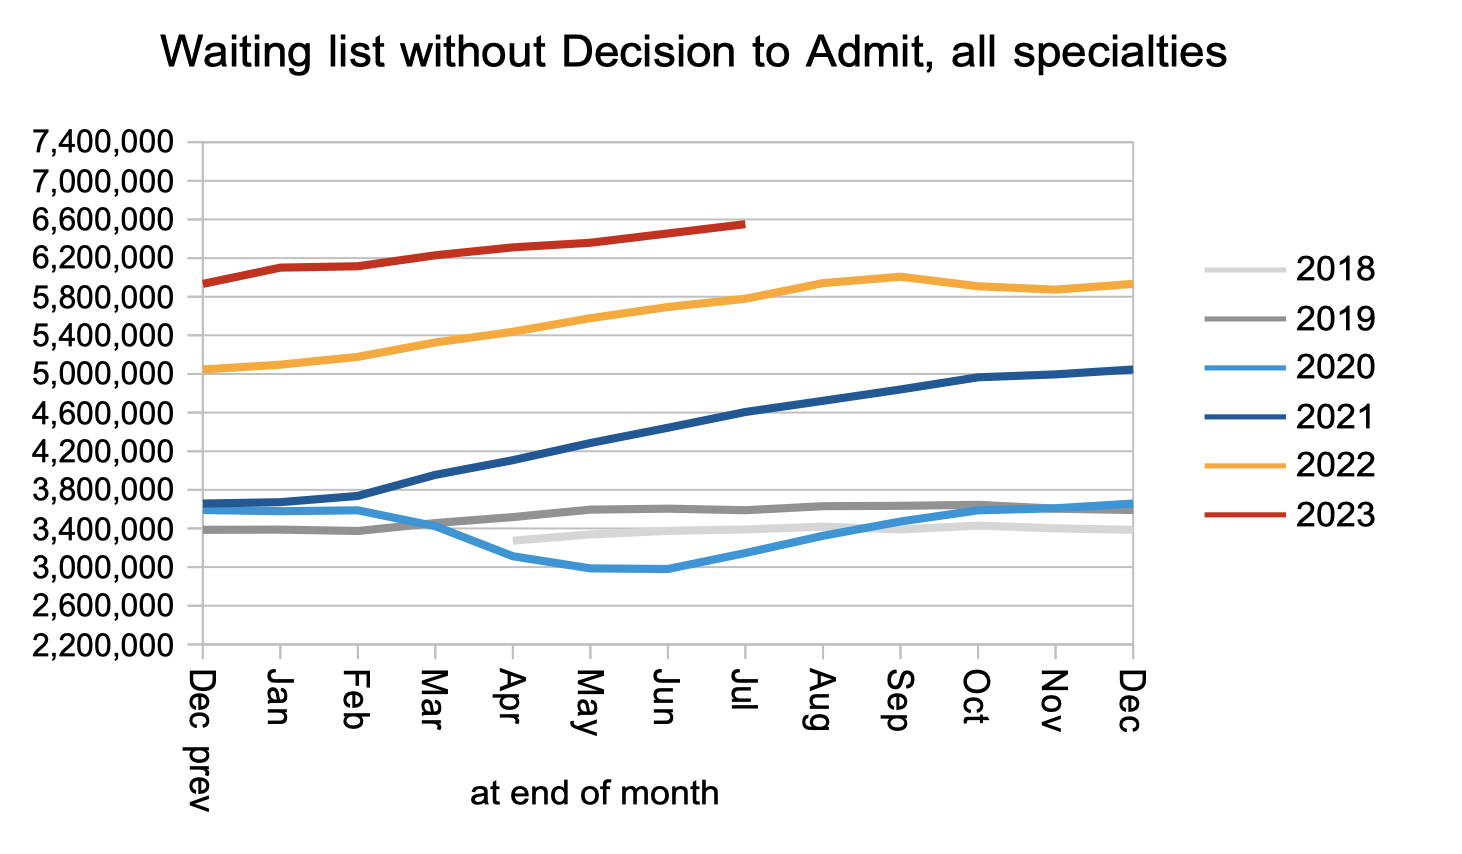
The consequence of this, and of the rate that patients received a decision to admit, was that the waiting list from referral to decision increased from 6.45 million to 6.55 million. This is the lion’s share of the total list of 7.68 million, which is a second reason for bringing the wait to diagnosis and decision down first: that is where the sheer numbers are. (There is a third reason to split the RTT target in two: it would greatly simplify capacity planning at the expensive treatment end of the elective pathway.)
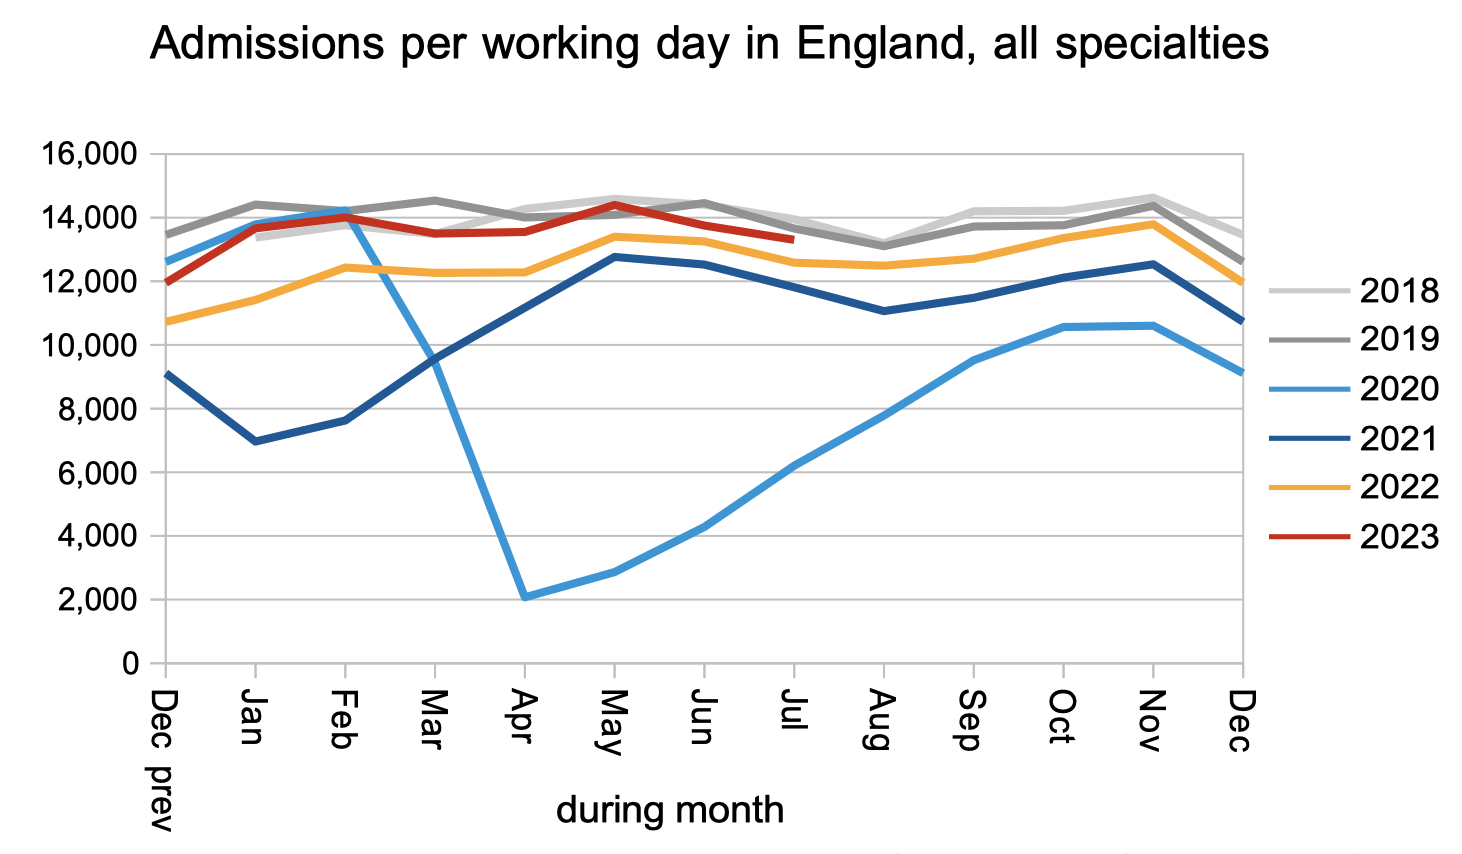
Admissions remained slightly below pre-pandemic levels. This may be largely explained by bed congestion.
The net effect of higher demand and subdued activity was a waiting list that continues to grow rapidly. The red triangle shows that the waiting list would need to fall by around 4 million patient pathways before the statutory 18 week target would be achievable again. That is a big non-recurring challenge. But the bigger (recurring) challenge is first to stop the waiting list from growing.
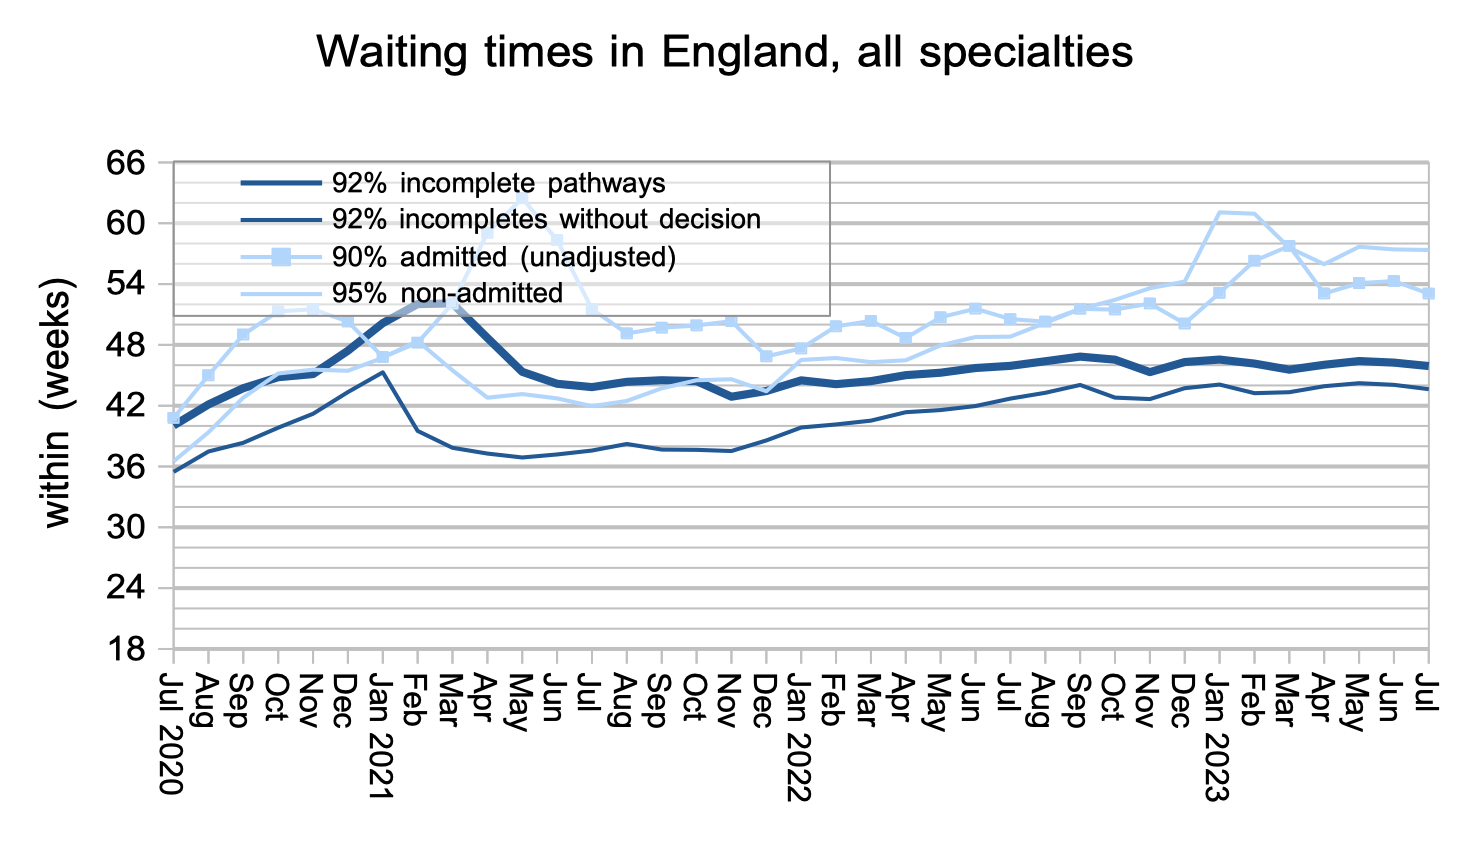
Waiting times have been bumping along at about the same (high) level for the last year, and this continued during July.
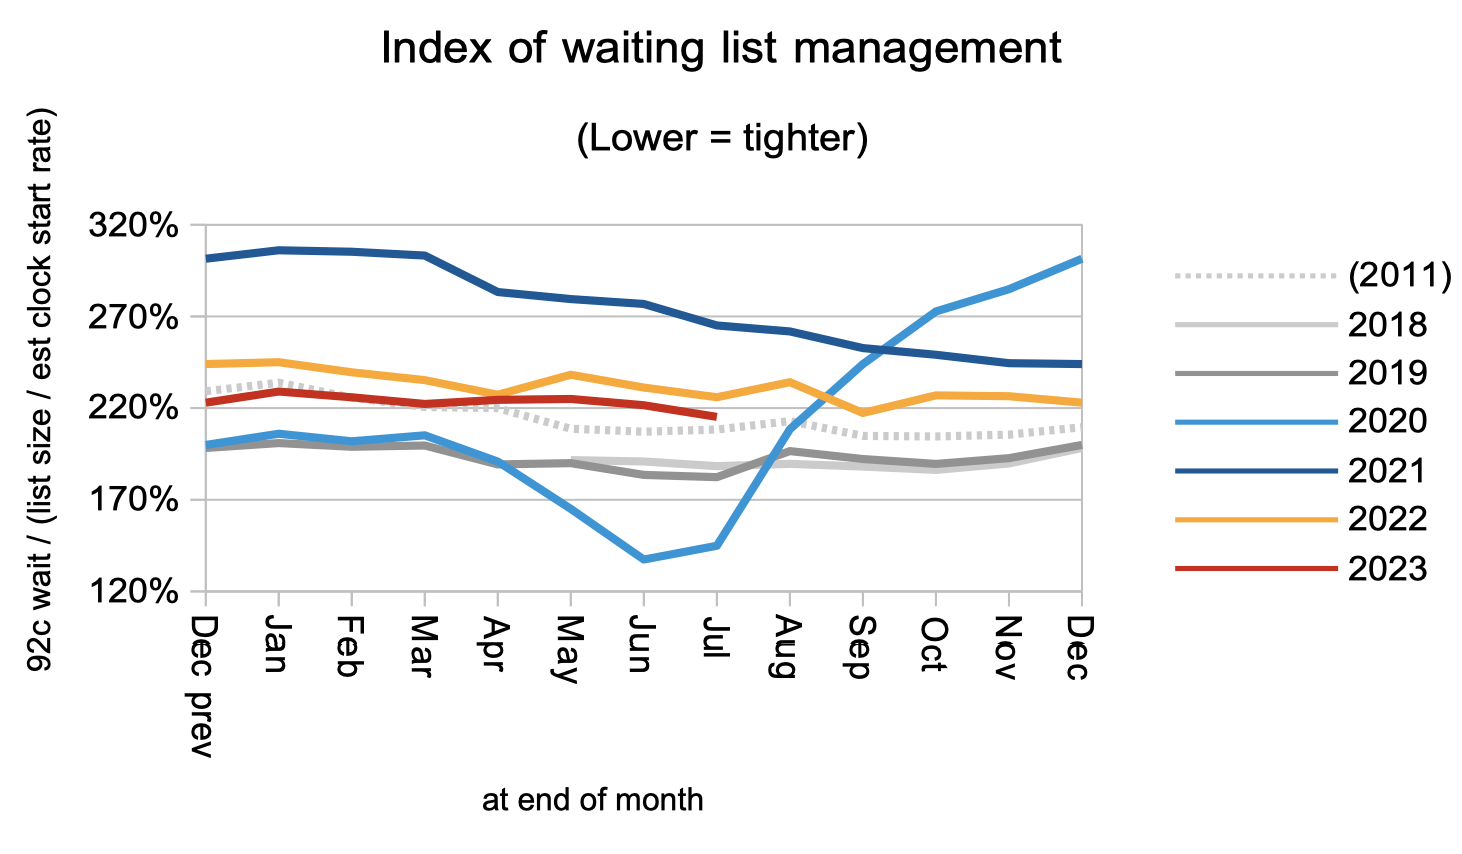
Waiting times are a function of both the size and shape of the waiting list, and the shape is summarised by the index below. In general, lower is better, although at some point a safe limit would be reached. The shape remains signifncantly worse than before the pandemic.
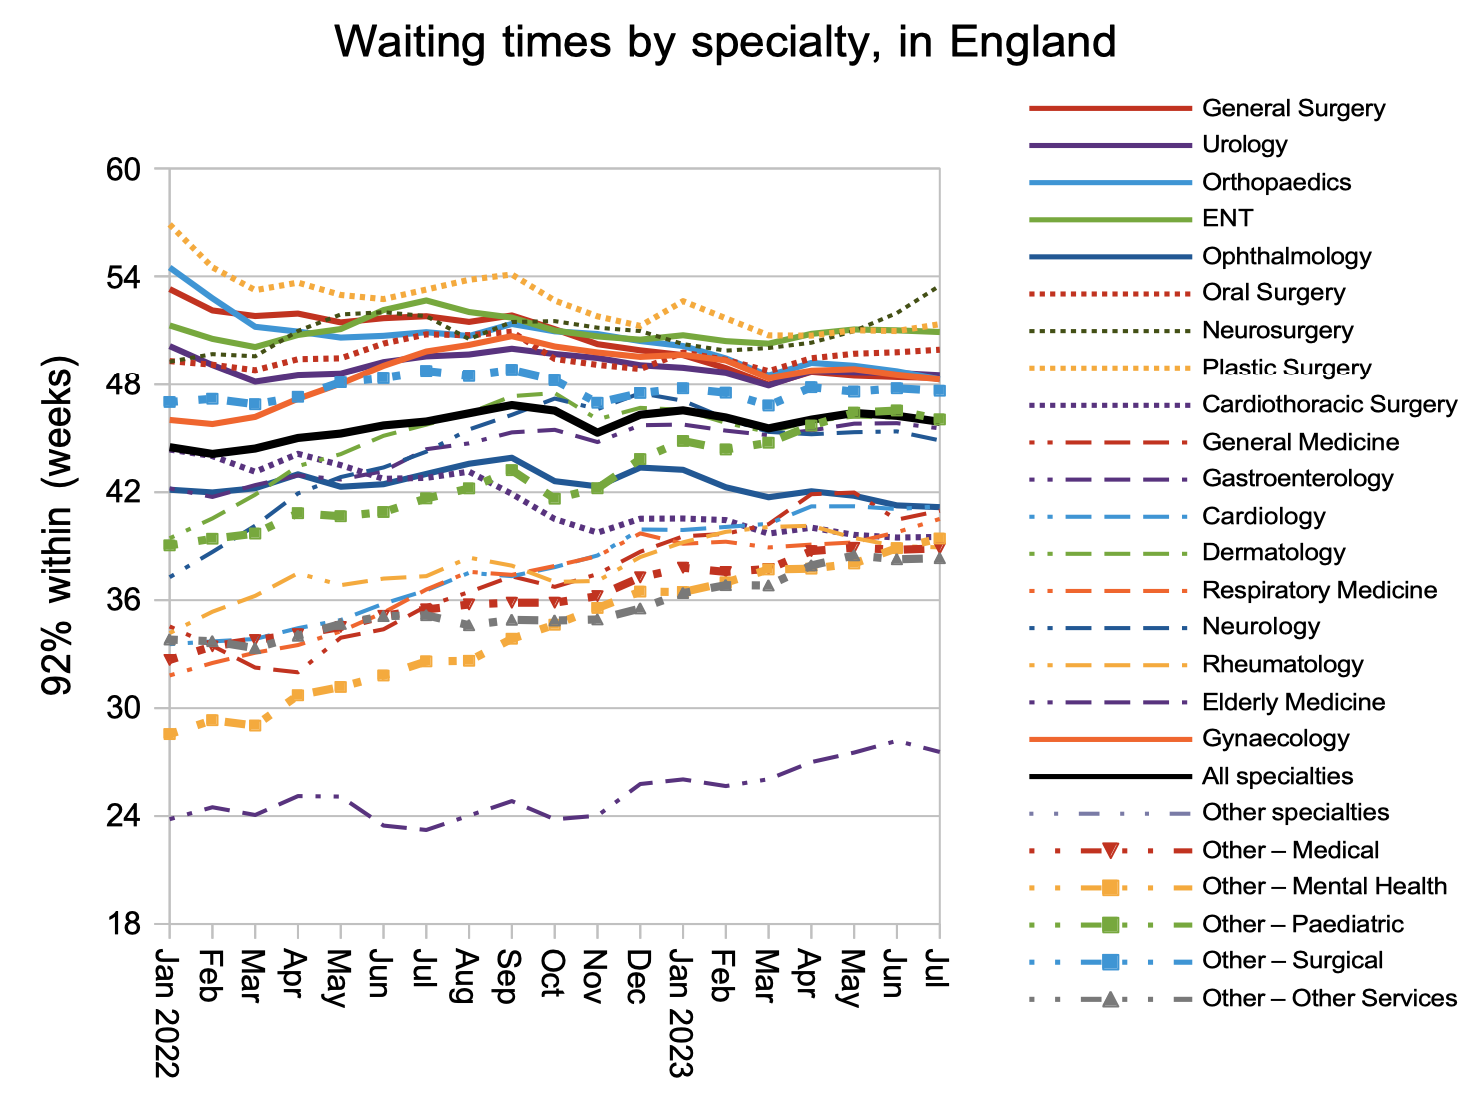
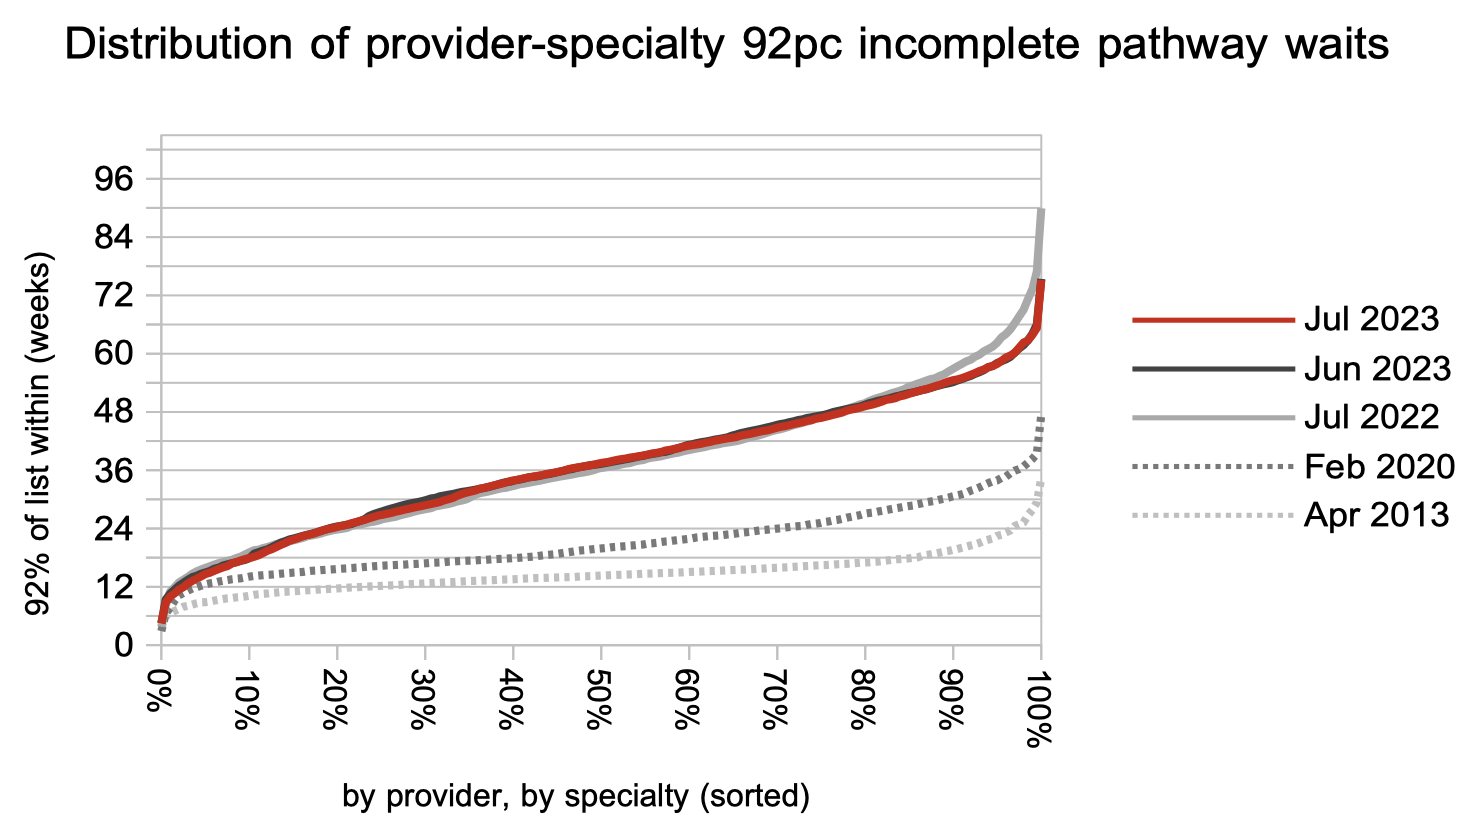
Waiting times at specialty level broadly reflected the steady position during July, without reversing the general convergence in waiting times that has been happening over the last couple of years.
Looking at over two thousand local specialties at NHS trusts across England, the distribution of waiting times has changed little over the last year, with the exception of the very longest waits which have fallen in response to the targets. This shows how the waiting time experience of most patients has not improved.
Referral-to-treatment data up to the end of August is due out at 9:30am on Thursday 12th October.