

The elective recovery gathered more speed in October, and waiting times rose by less than a week. This is good compared with the covid period so far, but still a rapid deterioration compared with normal times.
What are the prospects for 52 week breaches, which are catching the headlines and NHS England are keen to minimise by the end of March?
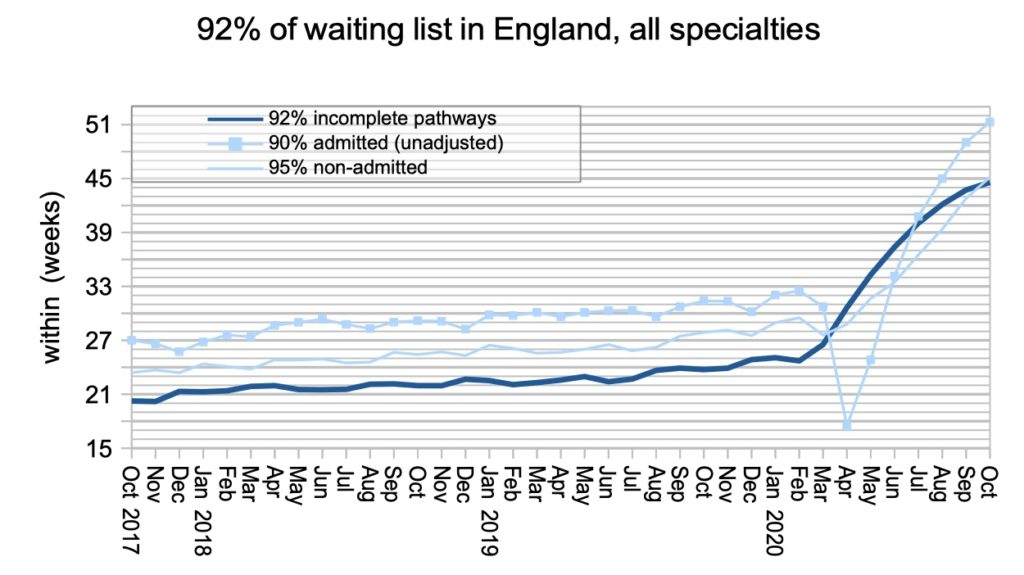
At the end of October, waiting times stood at 44.6 weeks (on the usual ’92 per cent of the waiting list’ measure), so if they grew by another 7.5 weeks by the end of March then the headline waiting time will have tipped over 52 weeks for England as a whole.
That’s a 7.5 week increase over five months. How likely is that?
After the covid restrictions began during March, waiting times rose very rapidly in the depths of the shutdown, but the rate has steadily slowed as elective services ramped up again. So in April, waits rose by 4.1 weeks – nearly a month in a month, the fastest possible. By August this had slowed to 2.1 weeks, and in October the monthly increase had slowed to 0.9 weeks.
Broadly speaking, then, the monthly increase in waiting times has ranged from four weeks under a full covid shutdown, to one week under a decent but still partial elective recovery.
Let’s make some guesses about increases for the rest of the financial year: a good November (1 week), heroic efforts in December (1.5 weeks), a difficult January (2.5 weeks), a difficult February (2.5 weeks)… and we’ve reached 52 weeks with March still to go.
All in all, it looks very likely that the headline waiting time measure will top 52 weeks by the end of March.
In the following discussion, all figures come from NHS England and NHS Improvement. If you have a national statistic that you’d like to check up on, you can download our waiting times fact checker.
For analysis of waiting times performance at a particular organisation, visit our reports page. You can also access maps of the latest waiting times across England for A&E, cancer, and RTT.
England-wide picture
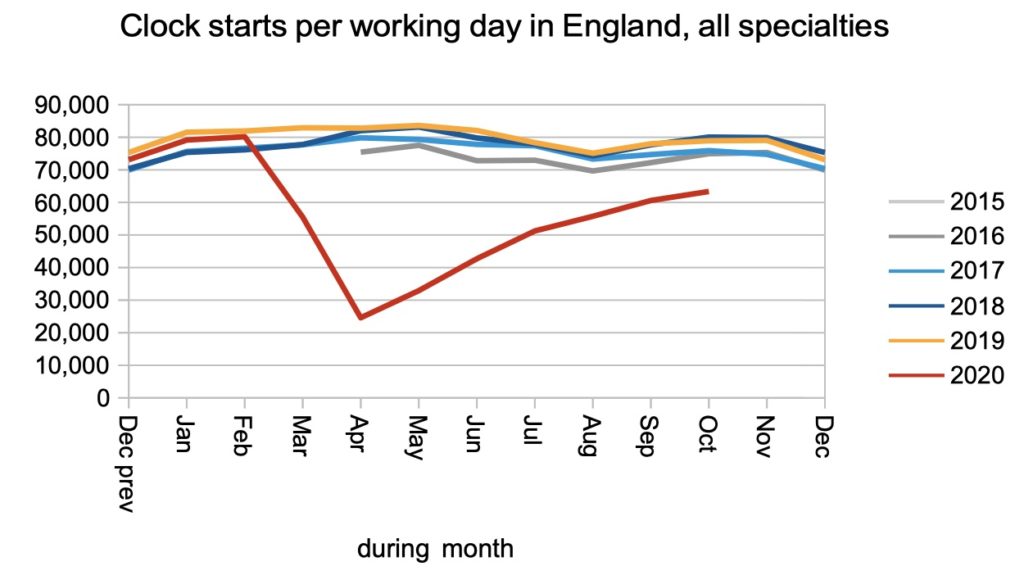
Referrals to consultant-led services (‘clock starts’ in RTT jargon) continued to recover but remained below pre-covid levels. Many patients have understandably stayed away from their GPs during covid, and that pent-up demand remains in the community and can be expected to come back at some point.
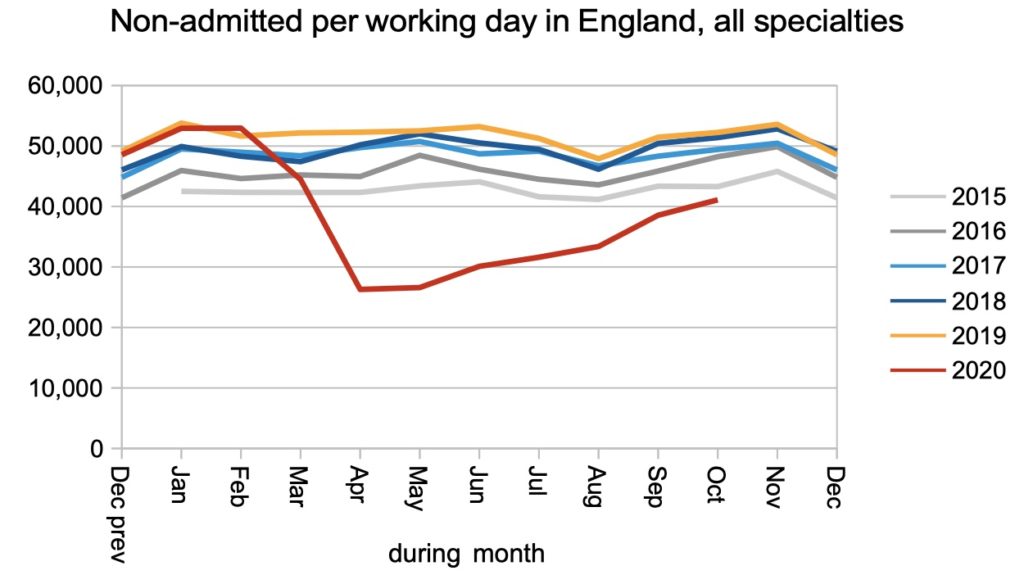
The numbers of patients being discharged from outpatients or for administrative reasons (‘non-admitted clock stops’) also increased to near pre-covid levels, as the elective recovery gathered pace with virtual clinics and other innovations.
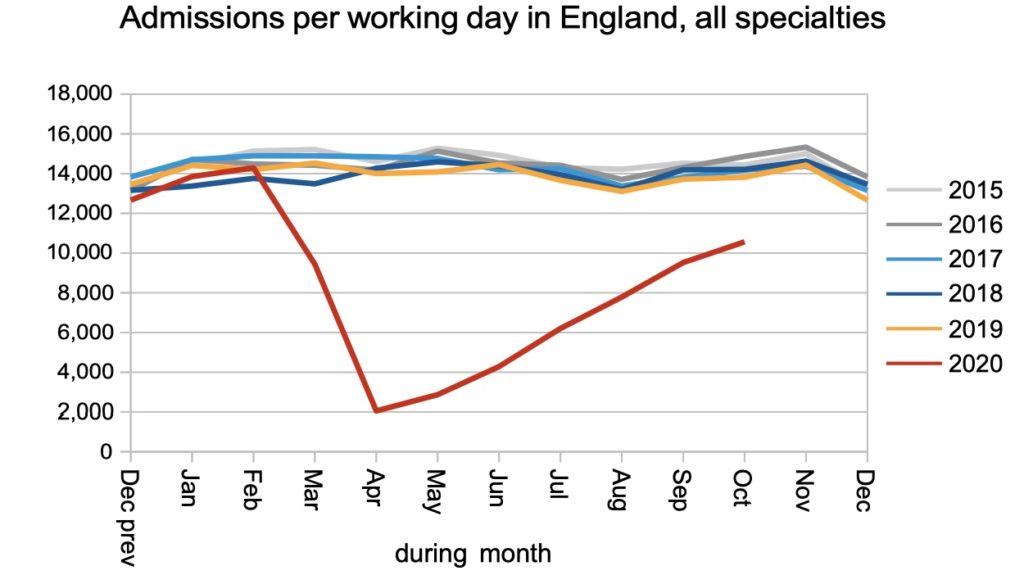
Admissions for inpatient and daycase treatment also recovered, but this is more difficult because of covid restrictions and the need for patients to physically come in.
Overall, then, October saw an increase in referrals which will tend to make the waiting list grow, and also an increase in activity which will tend to make the waiting list shrink. In October the referrals won this tug of war and the waiting list grew, probably to a record size when non-reported patients are taken into account.
But before anyone gets too excited about that, remember that the waiting list does not reflect the true backlog at the moment, because so many patients have been avoiding their GPs during covid. The underlying position is much worse.
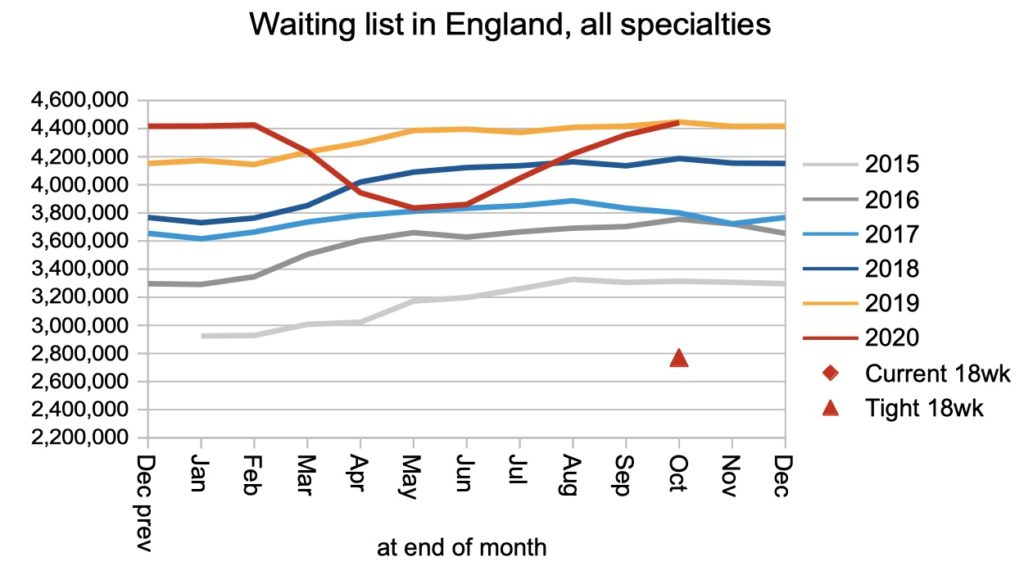
The rate of waiting times growth slowed in October as the elective recovery gathered pace. As the NHS heads into a difficult winter, we can probably expect this line to curve back up again in the coming months.
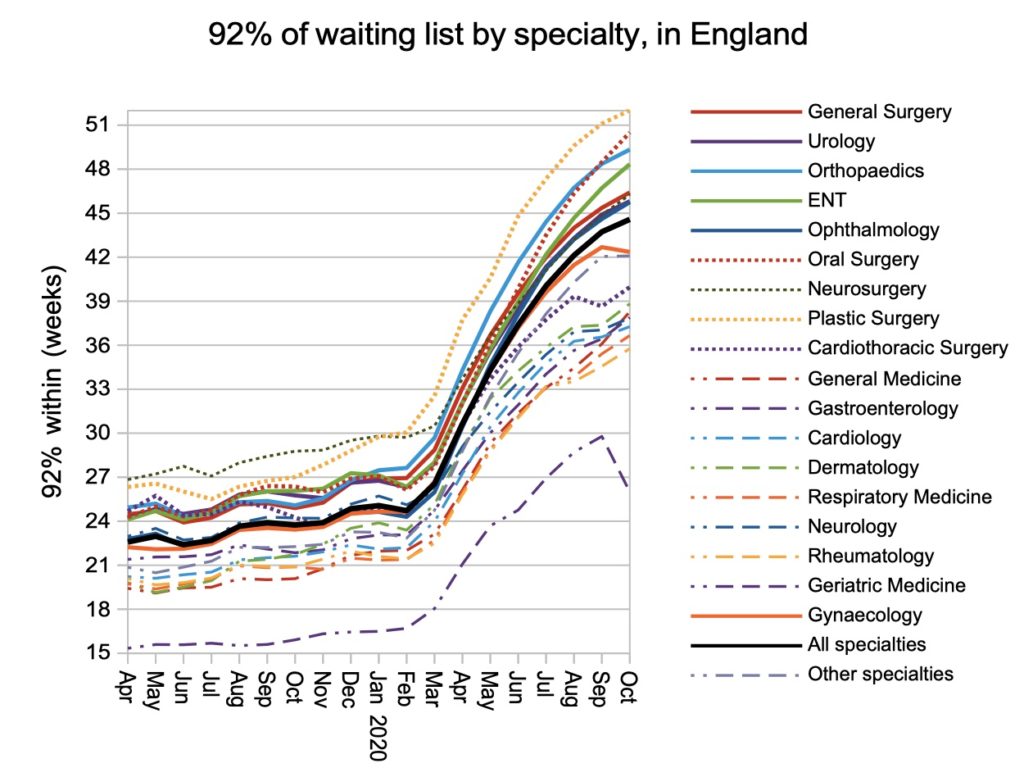
With only a couple of exceptions, the increase in waiting times was felt across all specialties. Plastic surgery has now exceeded 52 weeks at national level.
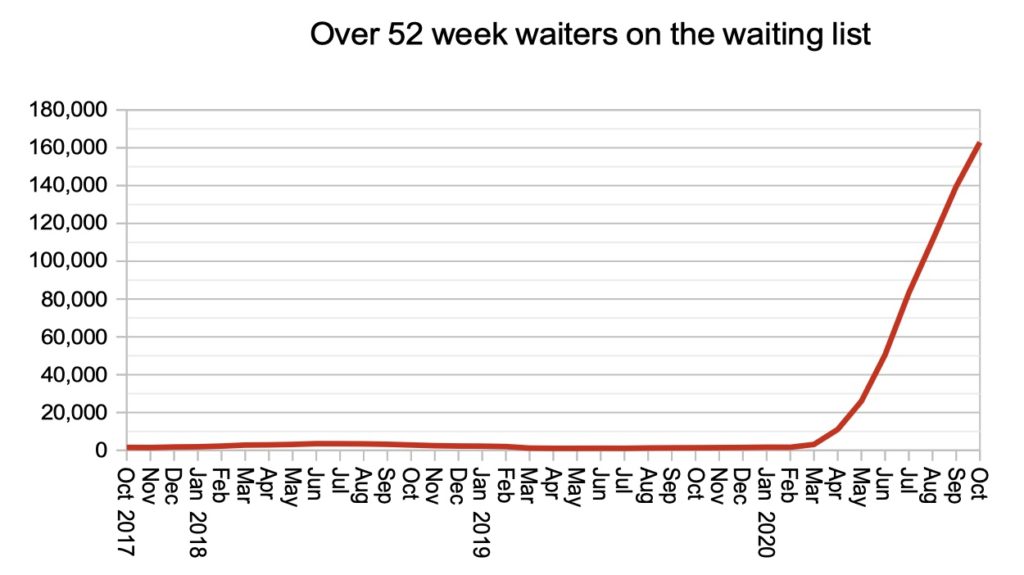
The number of 52 week waiters has been catching the headlines, but we do not know how long these patients are actually waiting. NHS England have collected data on the numbers waiting longer than 78 weeks and 104 weeks. Could they perhaps share this knowledge with the rest of us?
Local picture
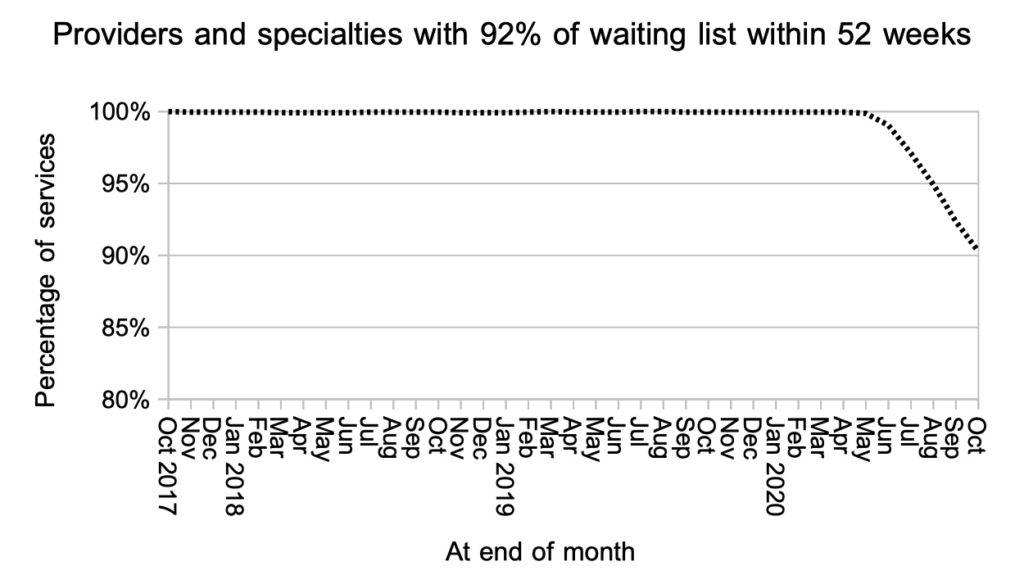
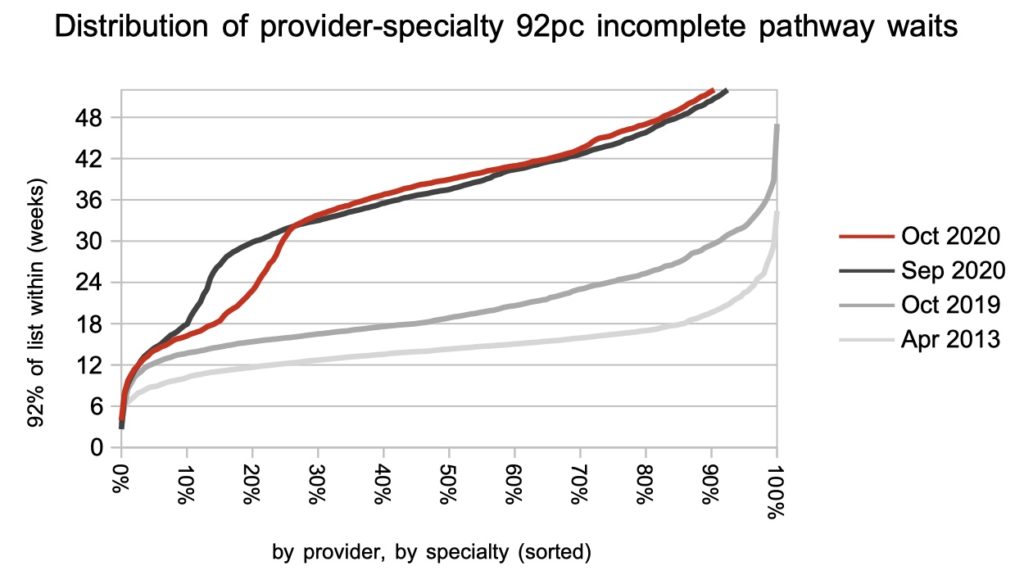
The proportion of local services (specialties within trusts) achieving 52 weeks continued to decline. Nearly one in ten local services have already breached that iconic waiting time.
Any improvements in waiting times were tightly clustered towards the short-waiting end of the waiting time distribution, as services limboed under the 18 week target where they were able to do so.
Referral-to-treatment data for November 2020 is due out at 9:30am on Thursday 14th January 2021.