

Many urgent conditions are only picked up at diagnosis, making such long waits risky
Analysis produced for Health Service Journal by Dr Rob Findlay, Director of Strategic Solutions at Insource Ltd and founder of Gooroo Ltd
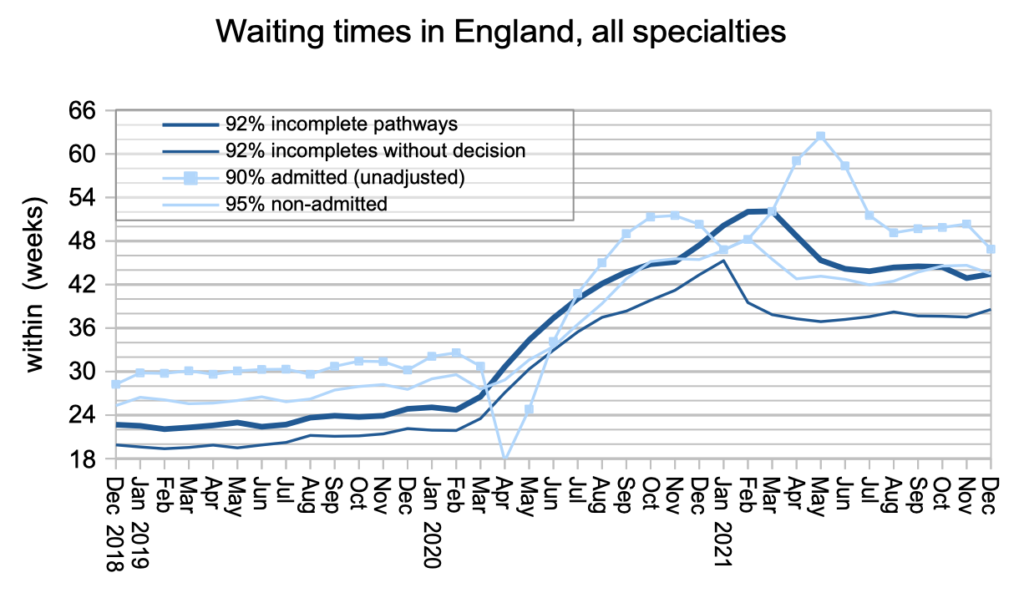
Waiting times to diagnosis and decision rose by more than a week in December, reaching 38.6 weeks at month end. This matters because many urgent conditions are only detected when the patient reaches diagnosis, including nearly a quarter of all cancers, and such very long waits put those patients at risk.
Looking at the whole referral-to-treatment (RTT) waiting list, which includes patients who have a diagnosis and decision, waiting times remained roughly steady at 43.4 weeks, compared with the standard of 18 weeks that is still required by legislation. Waiting times are a function of both the size and shape of the waiting list, and in December the former got worse, and the latter improved.
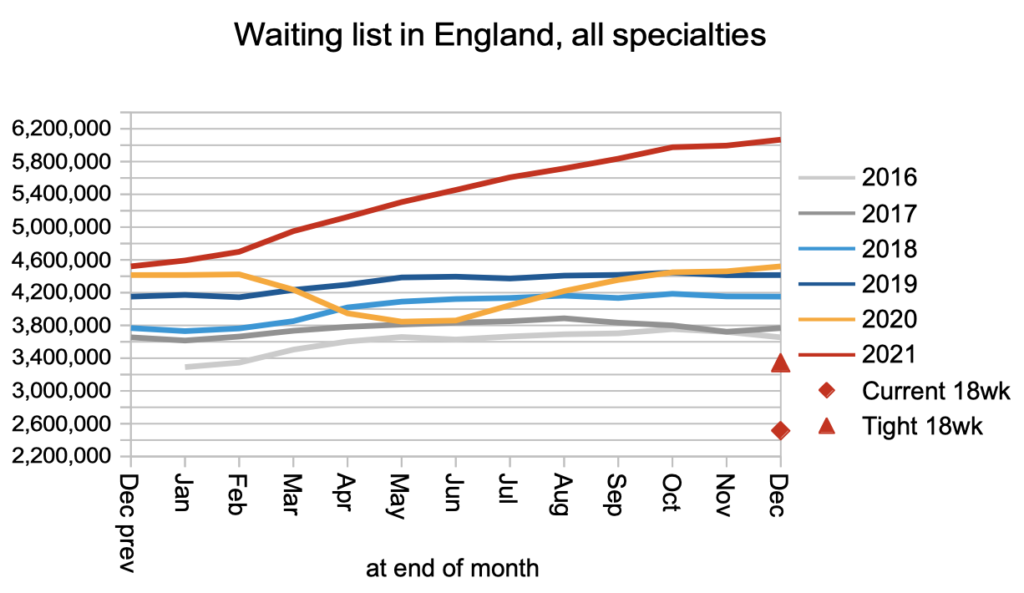
There were 6,067,326 patients on the waiting list as December ended, which is the first time the official figures have topped six million. 310,813 of them had waited over a year (strictly, 52 weeks), and 20,065 over two years (104 weeks). The NHS’s backlog recovery plan has committed that “By July 2022, no one will wait longer than two years for an elective treatment”.
In the following discussion, all figures come from NHS England. If you have a national statistic that you’d like to check up on, you can download our waiting times fact checker.
The numbers
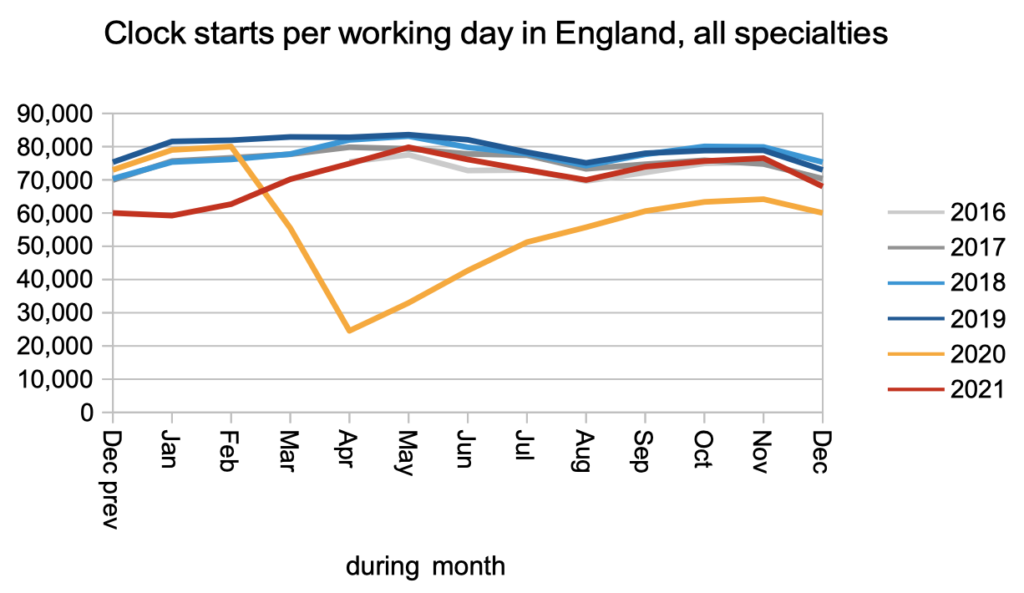
The flow of patients through the waiting list continued the pattern established since May 2021. Clock starts (patients joining the waiting list) remained close to the pre-covid level, with no sign yet of the millions of ‘missing referrals’ – the gap between the 2020 line and the others – surging back.
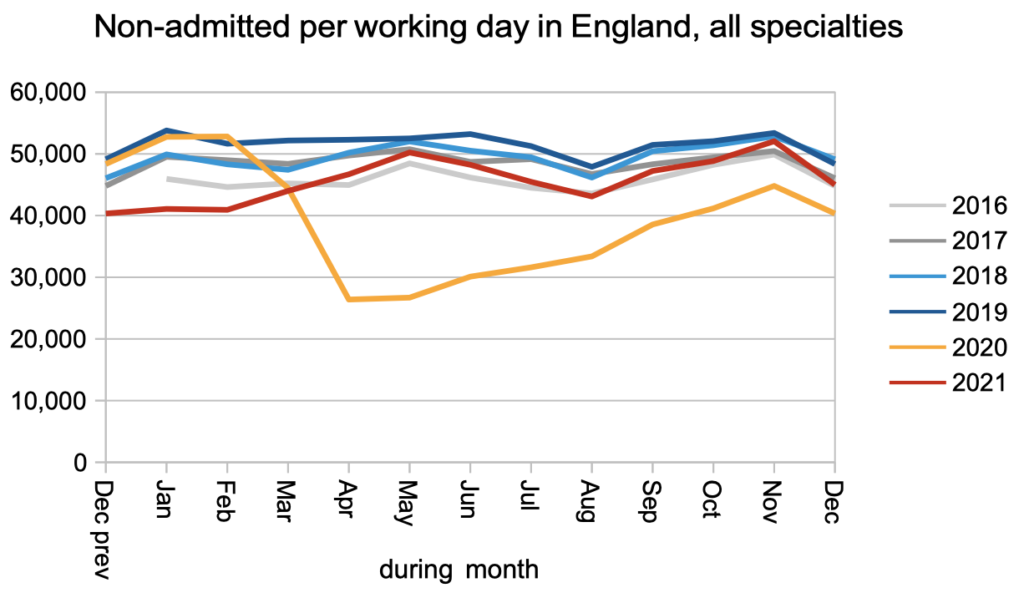
Similarly, non-admitted clock stops (patients discharged from clinic or otherwise removed from the waiting list without being admitted as inpatients or daycases) remained close to pre-covid levels.
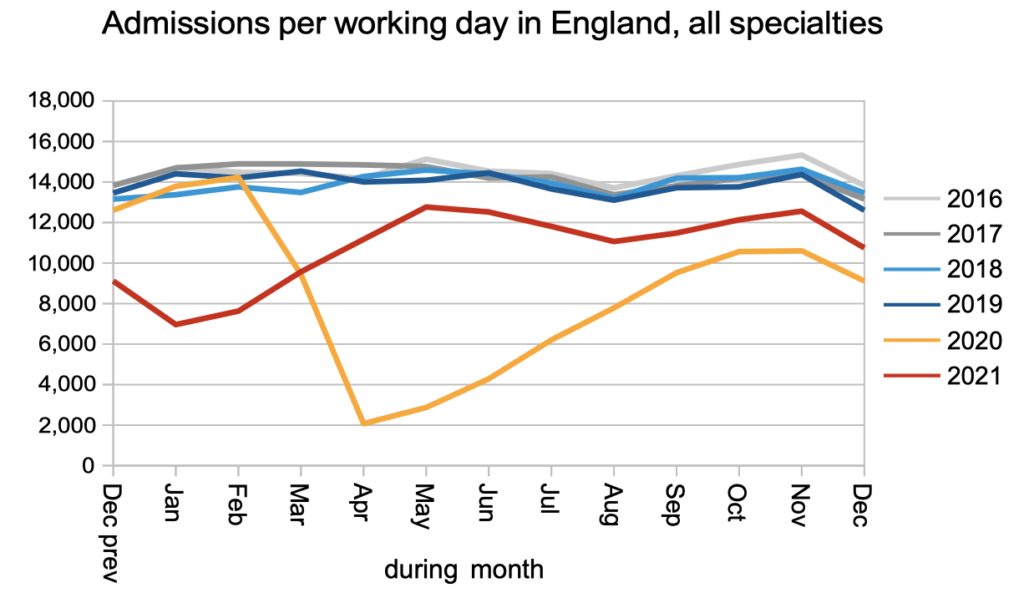
Admissions for treatment (as inpatients or daycases) remained significantly below pre-covid levels, reflecting the difficulty of physically admitting patients to hospital under covid restrictions and elevated levels of staff absence.
The waiting list continued to grow, powered by this combination of nearly pre-covid referrals and lower than pre-covid admissions. The RTT waiting list would need to fall to about 3.3 million to achieve the 18-week RTT standard.
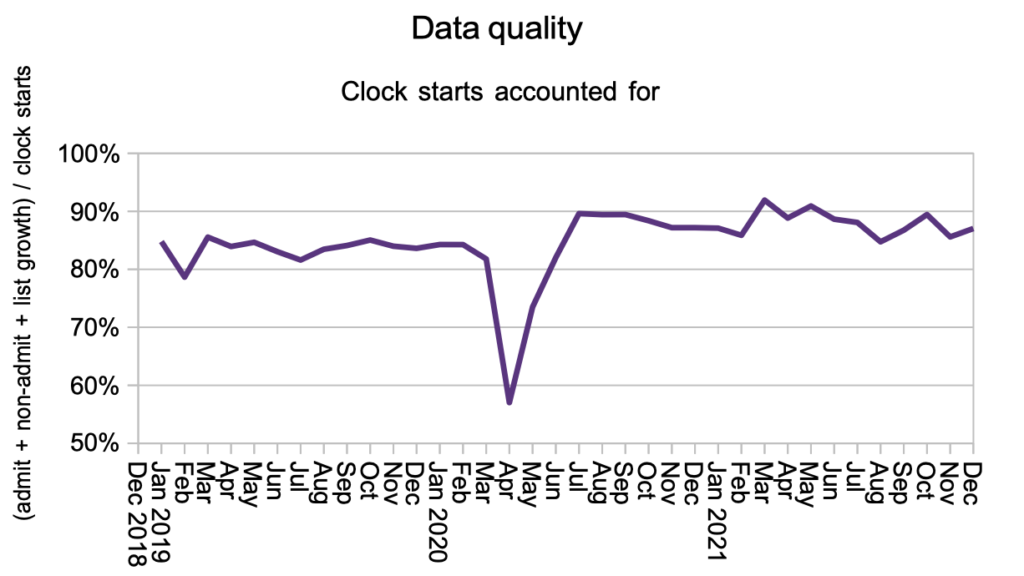
Data quality remained as poor as usual, with more than 10 per cent of clock starts unaccounted for in the rest of the data. There is no indication in these figures of any surge in validation activity (checking the data for patients who should not be appearing on the waiting list) causing patients to disappear from the figures.
Overall RTT waiting times remained roughly steady, but waiting times to diagnosis and decision to admit (‘incompletes without decision’, on the chart) ticked up by over a week.
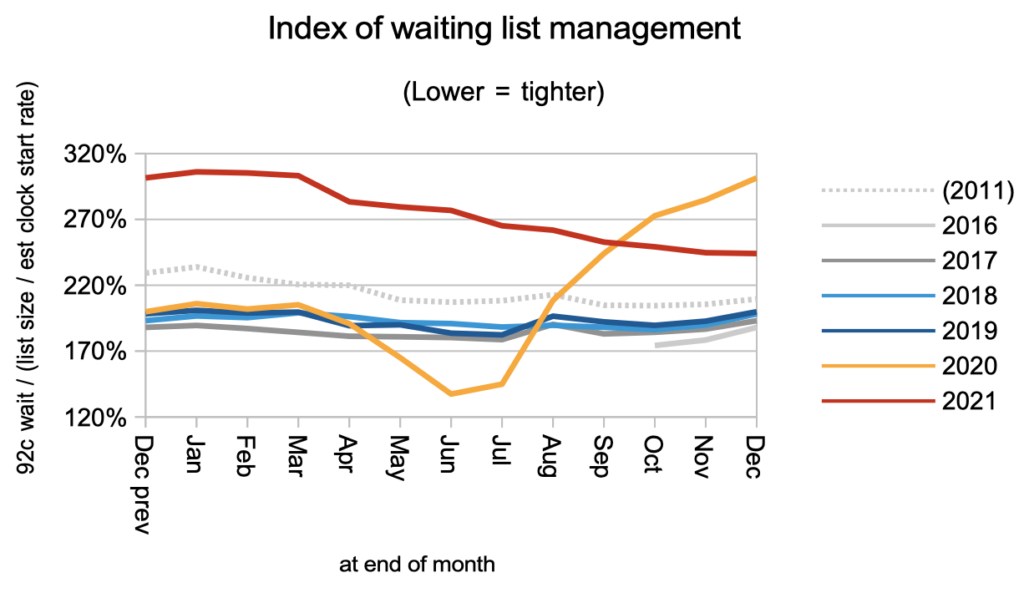
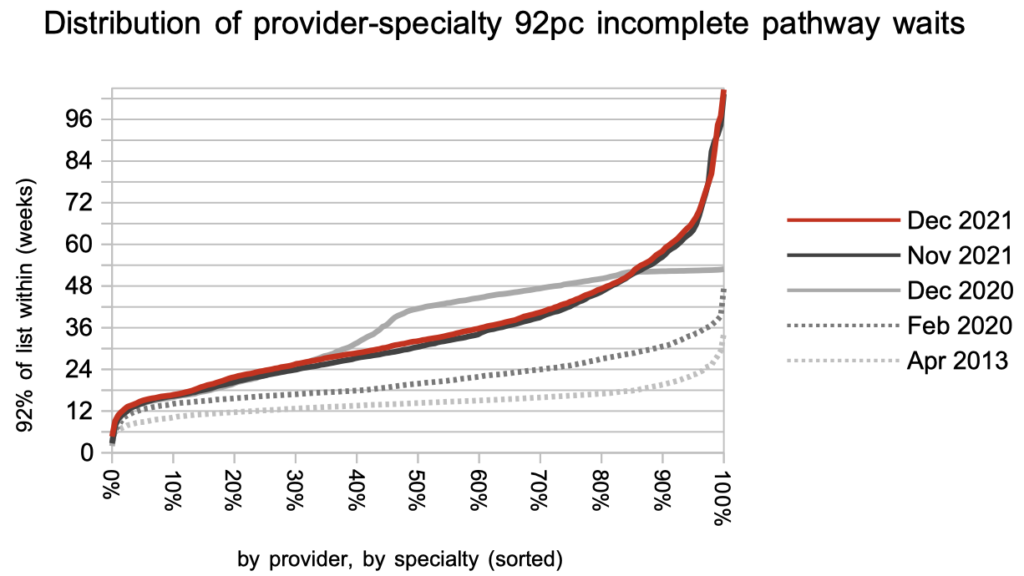
Waiting times are a function of the size of the waiting list relative to demand, and also of the order in which patients are treated, which is summarised in the chart below. The pandemic caused a very large deterioration in waiting list management, and this is now recovering slowly.
At specialty level, Plastic Surgery, Orthopaedics, ENT and General Surgery all have national waiting times longer than a year.
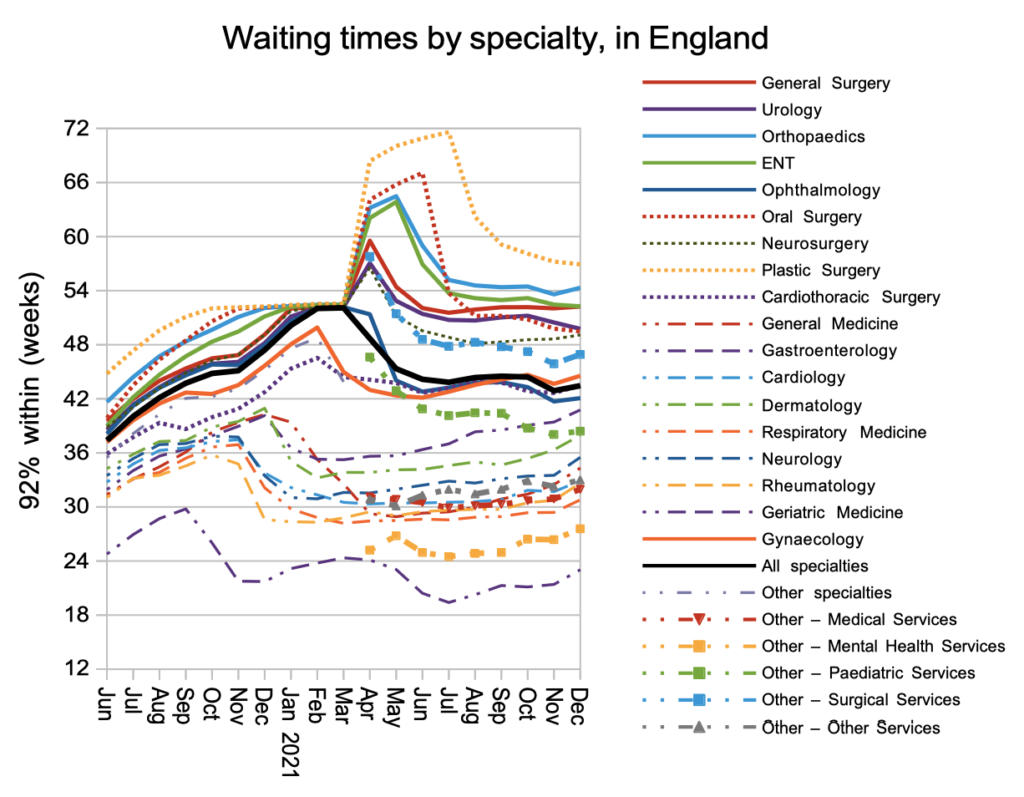
NHS performance is often characterised by gross and inexplicable variation, and waiting times are no exception. When looking at the chart below, which shows the waiting times across thousands of local specialties at providers across the country, remember that in December 2020 the numbers only went up to 52 weeks which is why the line goes flat.
Referral-to-treatment data up to the end of January 2022 is due out at 9:30am on Thursday 10th March.