

There’s a big difference between A&E and elective waiting times. If you could wave a magic wand and create all the capacity and systems needed for good A&E “flow”, then starting tomorrow you would have a perfect record on A&E waiting times.
But elective waits aren’t like that. Let’s say you’re struggling to keep up with the demand for elective care, and your waiting lists are so big that you can’t sustain the 18 week referral-to-treatment (RTT) waiting time target. Even if you could wave a magic wand today and start keeping up with demand, you would still be lumbered with that oversized waiting list – until, that is, you could devote enough time and effort to shrink it back to a sustainable size.
That is exactly the problem facing the English NHS today. It isn’t keeping up with elective demand, the waiting list is too big, and the bigger it gets the harder it will be to recover the 18 week target. I don’t see any prospect of this situation changing any time soon, and I’d like to explain why.
Waiting times are a function of two things: the size of the waiting list, and the order in which waiting list patients are treated. Both have been following a fairly consistent pattern at national level since the incomplete pathways target was introduced in early 2012, as the following charts (based on the official RTT statistics from NHS England) show.
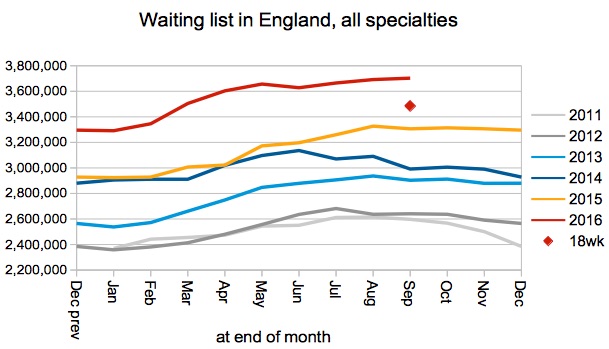
The waiting list goes up and down in a regular seasonal pattern, and it is also growing fairly consistently year-on-year. So we can use an average of these patterns to project future waiting lists under a “business as usual” scenario.
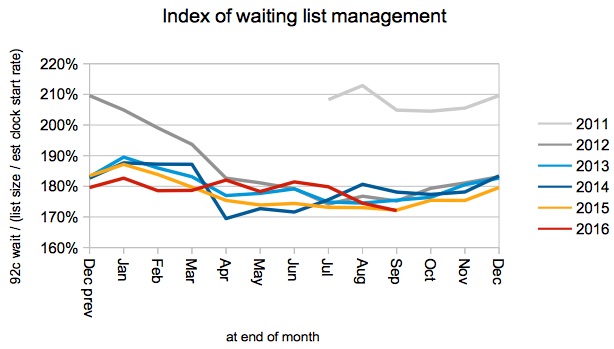
This index of waiting list management is also quite regular. There was a dramatic improvement when the incomplete pathways target was introduced in early 2012, and since then it has varied seasonally but otherwise remained remarkably stable. We can use this stability to estimate the size of waiting list consistent with achieving the 18 week RTT target (shown by the red dot in the top chart), and to project this sustainable list size into the future by combining it with estimates of future demand.
A couple of observations in passing:
- The stability of national waiting list management suggests that further improvement is unlikely to be achieved using national levers – so England’s waiting times are now driven mainly by the size of the waiting list.
- This index is appropriate for national-level waiting lists which are highly aggregated, but not for individual local waiting lists – they are best modelled more directly, taking into account clinical priorities as well as cancellations and other causes of scheduling disruption.
Projecting the actual and sustainable waiting lists into the future:
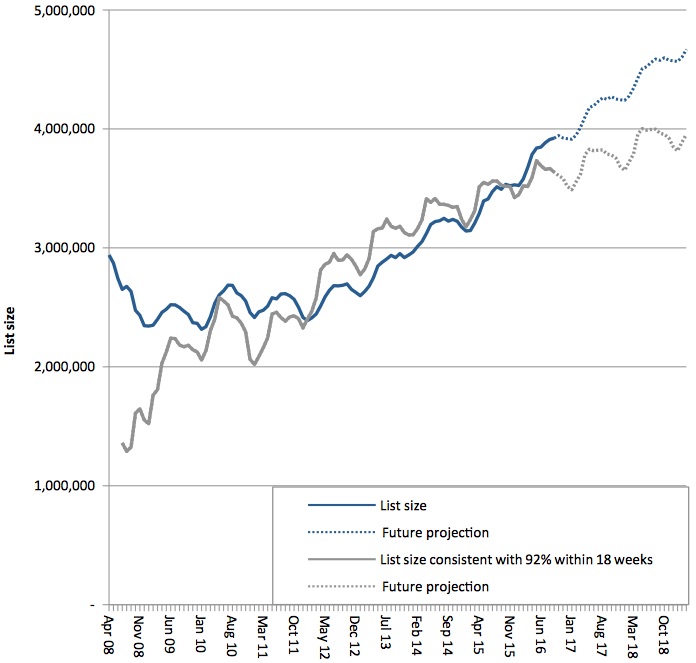
The lines crossed over in October 2015, which is when the 18 week target was first breached (if you add non-reporting trusts back into the data, as I have done for these projections). Since then, the waiting list has been too big to achieve 18 weeks, and the dotted lines show how the gap is projected to grow.
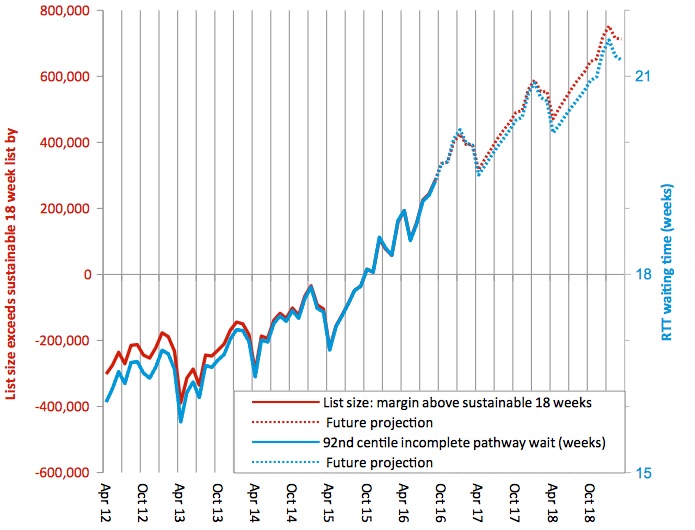
The next chart focuses in on that gap, showing the actual and projected margin by which the list size exceeds the sustainable 18 week level. It also shows the actual and projected national waiting times performance (on a 92 per cent of incomplete pathways basis), which is closely related.
The milestones in these projections (including non-reporting trusts) are:
- 4 million patients on the English waiting list from March 2017;
- 20 week waits temporarily after December 2016, then permanently from August 2017;
- 21 week waits from November 2018;
- waiting times continuing to grow by more than half a week RTT, every year, indefinitely.
What would it take to stop this from happening? If waiting list management remains stable nationally then we need to close the gap between the projected and sustainable list sizes, instead of letting that gap grow by around 150,000 patients per year. Can we do it?
Looking at the historical RTT data, in the year to September 2013 there were just over 14 million admitted and non-admitted clock stops. In the year to September 2016 that had risen to just over 15 million, an annual increase in activity of 2.3 per cent.
I estimate we need an extra 0.7 per cent annual increase in RTT activity to stop waiting times from growing any further, or an extra 1.1 per cent annually to get back to a sustainable 18 week wait by the end of March 2019. That is on top of the trend growth of 2.3 per cent – a pretty big increase that is unlikely to be affordable.
Could we reduce demand instead? Again, it is a pretty big decrease (and it isn’t as if demand reduction has never been tried before), and I doubt it would be achieved in practice.
Then there are risks on the downside: emergency demand squeezing out elective activity, and waiting list management deteriorating as 18 weeks slips further out of reach. All in all, it looks likely that RTT waiting times will carry on growing.