

Gooroo Planner now has advanced forecasting built in, as an alternative to the classic ‘projection’ method based on averages. This post introduces advanced forecasting in more detail and explains how it works.
One of the main differences between forecasting and projection, is that forecasting is much more responsive to recent change. This is especially important as the NHS emerges from the covid pandemic, because demand and performance will be seeking new levels and the NHS will need to respond quickly.
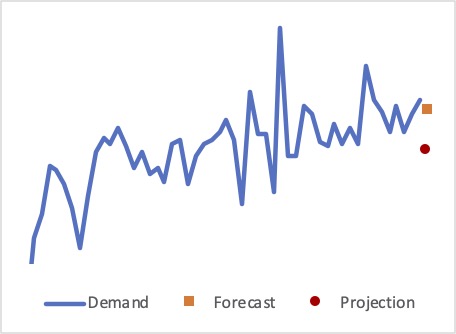
By contrast, the projection method is based on measuring averages over a historical period, and then rolling them forward, and this approach responds more slowly to recent changes. You can see a comparison between a forecast and a projection below, where the data has the kind of rising trend that we can expect after covid.
We did a lot of time-consuming and costly research before making our choice of forecasting methods, and you can read how we selected the forecasting techniques with the greatest skill here. This post will explain how the selected techniques work.
Introducing simple exponential smoothing
If I told you that we produced 400 widgets last week, and (without giving you any other information) asked you to forecast how many we will produce next week, then you might shrug your shoulders and say “probably about 400”.
If, a week later, I told you that we had actually produced 420 widgets, and asked you to forecast the following week’s production, then you might think: “it’s a bit early to call this a trend, and production probably bounces around a bit, so I’ll split the difference and go for 410”.
A week later, I tell you that we actually produced only 370 widgets that week. Again, you might split the difference between last week’s forecast (410) and last week’s actual (370), and use that to forecast the following week’s production at 390. And so on.
This is an example of simple exponential smoothing, and it is a remarkably powerful and skilful forecasting method.
In this case we were adding 50 per cent of the latest forecast to 50 per cent of the latest actual, but we could make the forecast more or less responsive to recent changes by adjusting that balance.
If, for instance, we thought that production fluctuated from week to week but the general level of production didn’t change very quickly otherwise, then we might add 80 per cent of the latest forecast to 20 per cent of the latest actual. That way, our forecast would shift more slowly as production levels changed.
In practice, the usual approach is to test different balances between the forecasts and the actuals, and use whatever works best with the historical data. This is often done using ‘optimisation’ to minimise the forecasting errors, and within Gooroo Planner we take care of this optimisation for you.
You might be wondering how to forecast two weeks ahead, or further. The answer is that the same forecast is used, no matter how far ahead you want to forecast.
Although it sounds quite simple (and it is), we found that simple exponential smoothing was overall the most skilful approach when forecasting non-elective demand up to several weeks ahead (when there is no change in the climatic season, e.g. autumn to winter) and also when forecasting a performance value such as average length of stay.
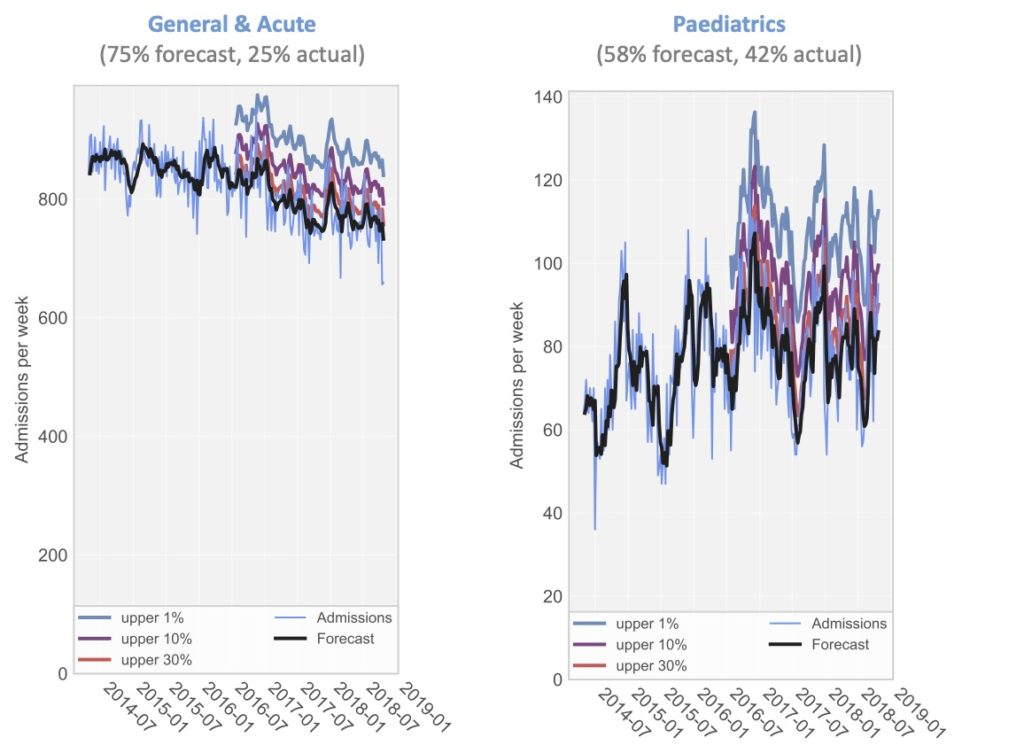
If you’d like to see simple exponential smoothing being used in real life, the charts below (which are taken from Gooroo Beds) forecast demand for two non-elective services: General & Acute, and Paediatrics. The black line is optimised for forecasting one week ahead at every step. The heading above each chart shows that it is better to be more responsive to recent changes when forecasting Paediatric demand, but to let the forecast ride through the fluctuations a bit more when forecasting General & Acute.
Introducing triple exponential smoothing (Holt-Winters)
If we want to forecast demand further into the future, then simple exponential smoothing can be a bit too simple. Winter is different from summer, and we need to take that into account.
In simple exponential smoothing we adjusted only one parameter to optimise our forecasting: the balance between the latest forecast and the latest actual. The ‘triple’ in triple exponential smoothing is a clue that we now have two further parameters available, one for the long term trend, and one for seasonality.
We found that triple exponential smoothing (also known as Holt-Winters after its inventors) showed greater skill at forecasting non-elective demand when there was a change in the seasons. However, perhaps surprisingly, we found that the forecasts were more accurate when trend was neglected, so we are only using the parameter that adjusts for seasonality within Holt-Winters.
(That does not mean that growth is being ignored, by the way. It isn’t. Gooroo Planner measures growth, tests it for statistical significance, lets you substitute your own assumptions, and applies the growth to the forecast. This gives you more control over the growth assumption that is being applied, which is particularly useful in annual planning when specific growth assumptions based on things like demographics are often required.)
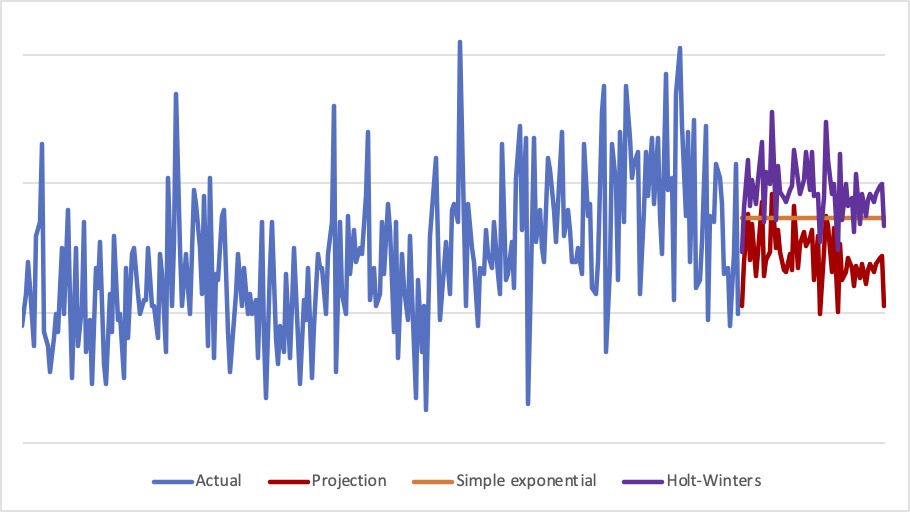
The chart below shows (in blue) the actual week-by-week demand over a five year period, followed by a comparison of the three methods:
- The red line uses projection – it looks at average demand in each calendar week, and projects that into the future; it looks somewhat low compared with the recent level of demand.
- The orange line shows a simple exponential forecast applied to the future period, and it reflects the level of demand better than the projection but does not include seasonality.
- The purple line shows a Holt-Winters forecast applied to the future period; this reflects both the recent level of demand and seasonality.
How forecasting is applied in Gooroo Planner
Gooroo Planner now has both simple exponential and Holt-Winters forecasting built-in, with the parameters automatically optimised in each case, and the software guides you to use the right method at the right time. (The classic ‘projection’ method, based on averages, is still available too.)
When you upload patient-level activity and additions data with the Forecast method activated, Gooroo Planner works out: the simple exponential and the Holt-Winters forecasts for demand (i.e. for non-elective activity and elective additions), and the Holt-Winters forecast for activity, as well as the simple exponential forecasts for the following performance measures:
- urgency
- average length of stay in bed (split urgent / non-urgent)
- proportion of patients using a bed
- theatre and clinic time available
- theatre and clinic minutes per patient (split urgent / non-urgent)
- theatre and clinic utilisation
- price per patient (split urgent / non-urgent)
At the next step in the process, when you create a report, you will notice some new options in the Calculation Settings that guide you to the best forecasting approach for demand. Demand deserves particular care, because it is the foundation of all demand & capacity planning.
If the future period ends very soon after the past period, and so there is no change in the climatic seasons, then the settings will prompt you to use simple exponential smoothing.
If you are forecasting further ahead, then the settings will prompt you to use Holt-Winters, but only if there is enough data to calculate seasonality. The settings will encourage you to calculate seasonality if you had at least 5 years of historic data available, and a minimum of 3 years. If you have less data than that, then it will not be possible calculate seasonality reliably, and you would usually get a more accurate forecast using simple exponential smoothing.
You always have the option to ignore these prompts and set it up your way, but the prompts have been designed based on evidence so this would very much be your choice.
Things to watch out for
Because forecasting is responsive to recent events, you will want to make sure that those recent events are not weird. For instance, if your past period stops at the end of December, then the last week or two of your data may be skewed by the Christmas and New Year holiday.
A more subtle (but nevertheless common) problem happens if you count admissions but filter discharges, as the charts below show.
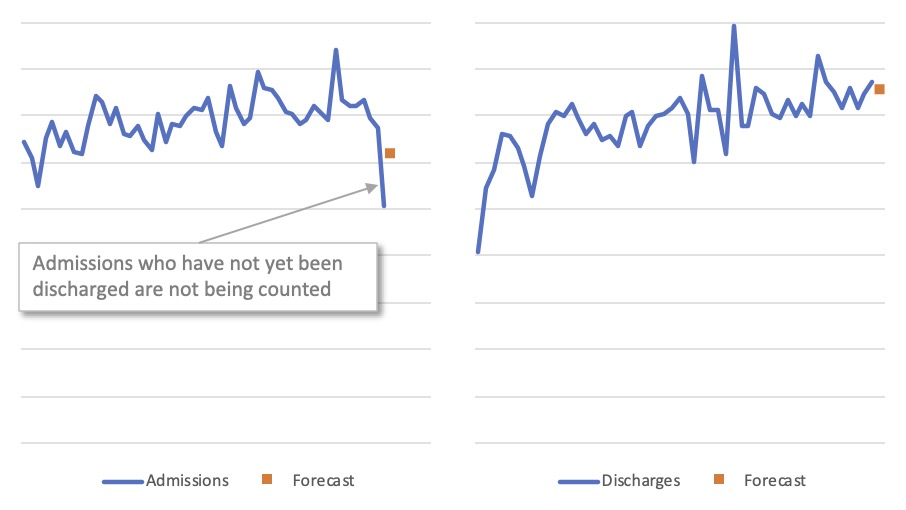
Both charts show the same data, which is filtered to include discharges up to a particular date. The difference is that the chart on the left counts admissions, whereas the chart on the right counts discharges.
The chart on the left tails-off at the end, because patients who have been admitted, but are still in hospital at the cutoff date for discharges, are not being counted. The orange dot shows that this skews the forecast of future demand.
The chart on the right is based on discharges and does not suffer from the problem caused by the discharge-based cutoff.
If you based your forecast on the left-hand chart, the forecast demand would be some 18 per cent lower than the forecast in the right-hand chart.
Finally, you might be wondering what happens if your past period ends mid-week, so that the final week in your data series is only a few days long. Don’t worry, we have taken care of this for you – Gooroo Planner only uses whole weeks from your past period. So you can still start and end your past period on any date.
As always, if you have any questions then please get in touch. If you aren’t using Gooroo Planner yet, and would like to learn more, then ask for a free online demo.