

England’s waiting times are already longer than a year. The pent-up demand, from patients who have been avoiding the NHS during the covid pandemic, is still waiting in the wings. And the service will be constrained by covid prevention measures for months to come; the elective recovery will only get underway when activity rises above demand.
How bad will it get? And what will we need to do about it?
The uncertainties are huge, especially the pent-up demand. What proportion of those ‘missing referrals’ will come back? Two thirds? One third? You could make a hand-waving argument that those patients who would have needed treatment will, probably, mostly come back to get it. But we quite simply do not know. It is even possible that the thresholds at which patients seek care have shifted permanently.
There is huge uncertainty on the supply side too. How much activity will the NHS be able to do? When will covid restrictions be lifted, allowing a return to full capacity? How fast could the NHS recover waiting times? Three years? The rest of the decade? How will improvements in pre-diagnostic pathways help?
But we have to do something, and we need to make some guesses. This analysis will consider two.
Both of the following scenarios look at the elective RTT waiting list only, and ignore the other important things that will also need to be tackled, such as the pressures on follow-up outpatients, non-elective beds, workforce, capital backlog, non-acute care, and the rest. The scenarios also ignore the trend growth in elective demand which is meant to be funded through the normal spending round, because it would obscure the central analysis if it were included; instead, underlying demand is assumed to continue at 2019 levels. And the assumption is that we want to recover to a visibly better position than before, which we will take in three phases.
The three phases
The first phase is the period covered by the latest planning guidance: up to the end of September 2021. Things get worse during this phase, because activity is still constrained, and the pent-up demand that has accumulated under covid is coming back. To keep things simple, I will assume that all of the pent-up demand comes back by the end of September; this may not happen in practice, but the timing doesn’t affect the overall scale of the challenge, only what happens to waiting lists and waiting times in the middle.
The second phase runs from October 2021 to March 2025, and tackles waiting times from referral up to diagnosis and decision to admit. I will refer to this stage of the pathway as Referral-Decision.
It is important in the interests of clinical safety to reduce Referral-Decision waiting times first. If large numbers of undiagnosed patients are made to wait for long periods of time, even if they are thought to be ‘routine’, it is inevitable that some will turn out to have undiagnosed cancers or other urgent conditions which have progressed during the delay. Referral-Decision waits are long – ten per cent of those waiting list patients who do not have a decision to admit are waiting longer than 34 weeks – so there is already significant unknown risk among undiagnosed patients.
The solution is to reduce Referral-Decision waiting times for all patients, even if the short-term consequence is to lengthen the waiting time for admission (the Decision-Treatment stage of the RTT pathway) in a controlled way. This is the opposite of the current approach which focuses on treating those patients with the longest RTT waits, even though they are much more likely than shorter-waiters to have a diagnosis and decision.
Short Referral-Decision waits are also more efficient. The outpatient booking process becomes much simpler, and less disrupted by cancellations, when new outpatient waits are shorter than the six weeks’ notice that clinicians give when taking annual leave. And the Referral-Decision stage is where most of the patients are, so short waits avoid the high administrative costs, errors and risks that come with very large waiting lists.
The third phase finishes the job by tackling Decision-Treatment waits from April 2025 to December 2028. This is where most of the clinical costs are, so planning and managing these waiting lists and admissions is significant for the efficiency and performance of the whole hospital.
However, at present, the RTT targets get in the way. RTT waiting times are calculated from the original referral date, which is usually held in a different part of the hospital’s IT system from the waiting list for admission (i.e. the Decision-Treatment waiting list). Hospitals manage this by constructing a ‘PTL’ – a special kind of waiting list designed for RTT, which gathers patients from multiple IT systems and measures waiting times since referral; this is a complex task that is usually performed centrally for the trust, once a week. So the managers who are responsible for admitting patients have to rely on information that is not under their control and quickly goes out of date, which leads them to plan and manage admissions in batches, at the margins, and just a few weeks ahead.
These problems can be solved by splitting the RTT target fully, with a separate target for Decision-Treatment waits, because then the managers of admitted patients have all the information they need locally, and in a form that lends itself to planning. In fact, managers already take this approach when creating demand and capacity plans, because RTT-based data does not distinguish clearly between one type of capacity and another.
Tougher and lighter scenarios
We will deal with the massive uncertainties by looking at two scenarios – a tougher one, and a lighter one – and in the commentary below I’ll present the numbers in the form “tougher {lighter}”. These scenarios are not necessarily the worst {best} case scenarios, and real life might turn out to be even tougher {lighter} than they are.
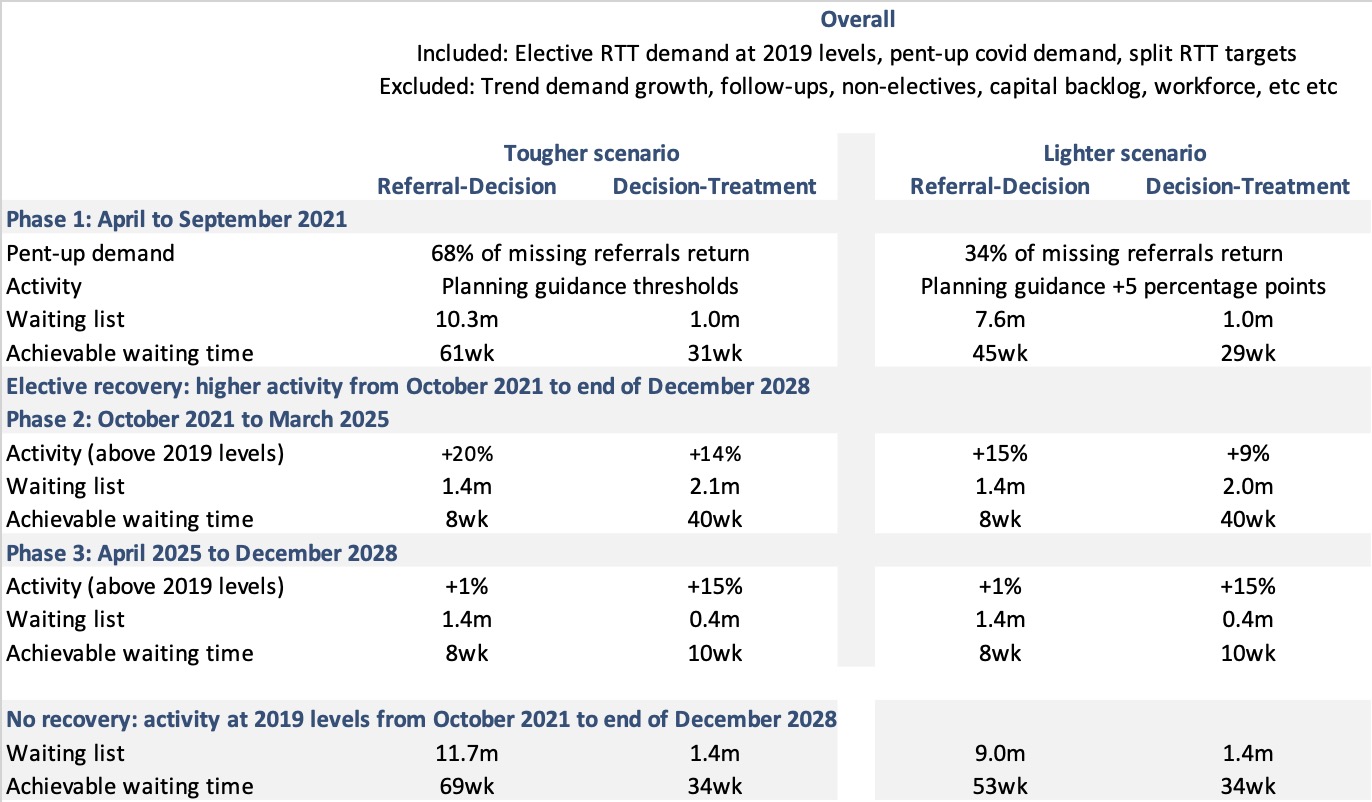
The tone for each scenario is set in the first phase. The tougher {lighter} scenarios assume that 68 {34} per cent of the missing referrals come back, and that activity is zero {five} percentage points higher than the monthly thresholds in the planning guidance.
At the end of the first phase, Referral-Decision waits reach 61 {45} weeks, with a waiting list of 10.3 {7.6} million patients at this stage. Then in the second stage of the split pathway, Decision-Treatment waits in both scenarios reach about 30 weeks with a waiting list of 1 million patients. Clearly there will be a bigger mountain to climb in the tougher scenario, because of the ballooning number of patients waiting for diagnosis and decision.
After the first phase, if there were no recovery and activity remained at pre-covid levels then these waiting times would slowly deteriorate further, just as they were deteriorating before covid.
The second phase brings Referral-Decision waits down to a safe 8 weeks, which requires outpatient and diagnostic activity to run 20 {15} per cent higher than pre-covid levels until March 2025. This is a significant increase which is likely to rely fairly heavily on improved outpatient and diagnostic pathways. Decision-Treatment waits grow, but are controlled to a maximum of 40 weeks for that stage of the split pathway, which requires admissions to run 14 {9} per cent higher than pre-covid.
The third phase tackles Decision-Treatment waiting times, bringing them down to 10 weeks in December 2028. So when Referral-Decision waits are added to Decision-Treatment waits, RTT waits end up at 18 weeks; but this is much better than the original RTT target because all patients have a short wait to diagnosis and decision, and patients waiting for admission do not have to wait longer if they happened to reach decision quickly. In both scenarios in this phase, outpatient and diagnostic (Referral-Decision) activity runs just one per cent above pre-covid levels to maintain a final waiting list of 1.4 million, and admissions run 15 per cent above pre-covid for a final waiting Decision-Treatment list of 0.4 million.
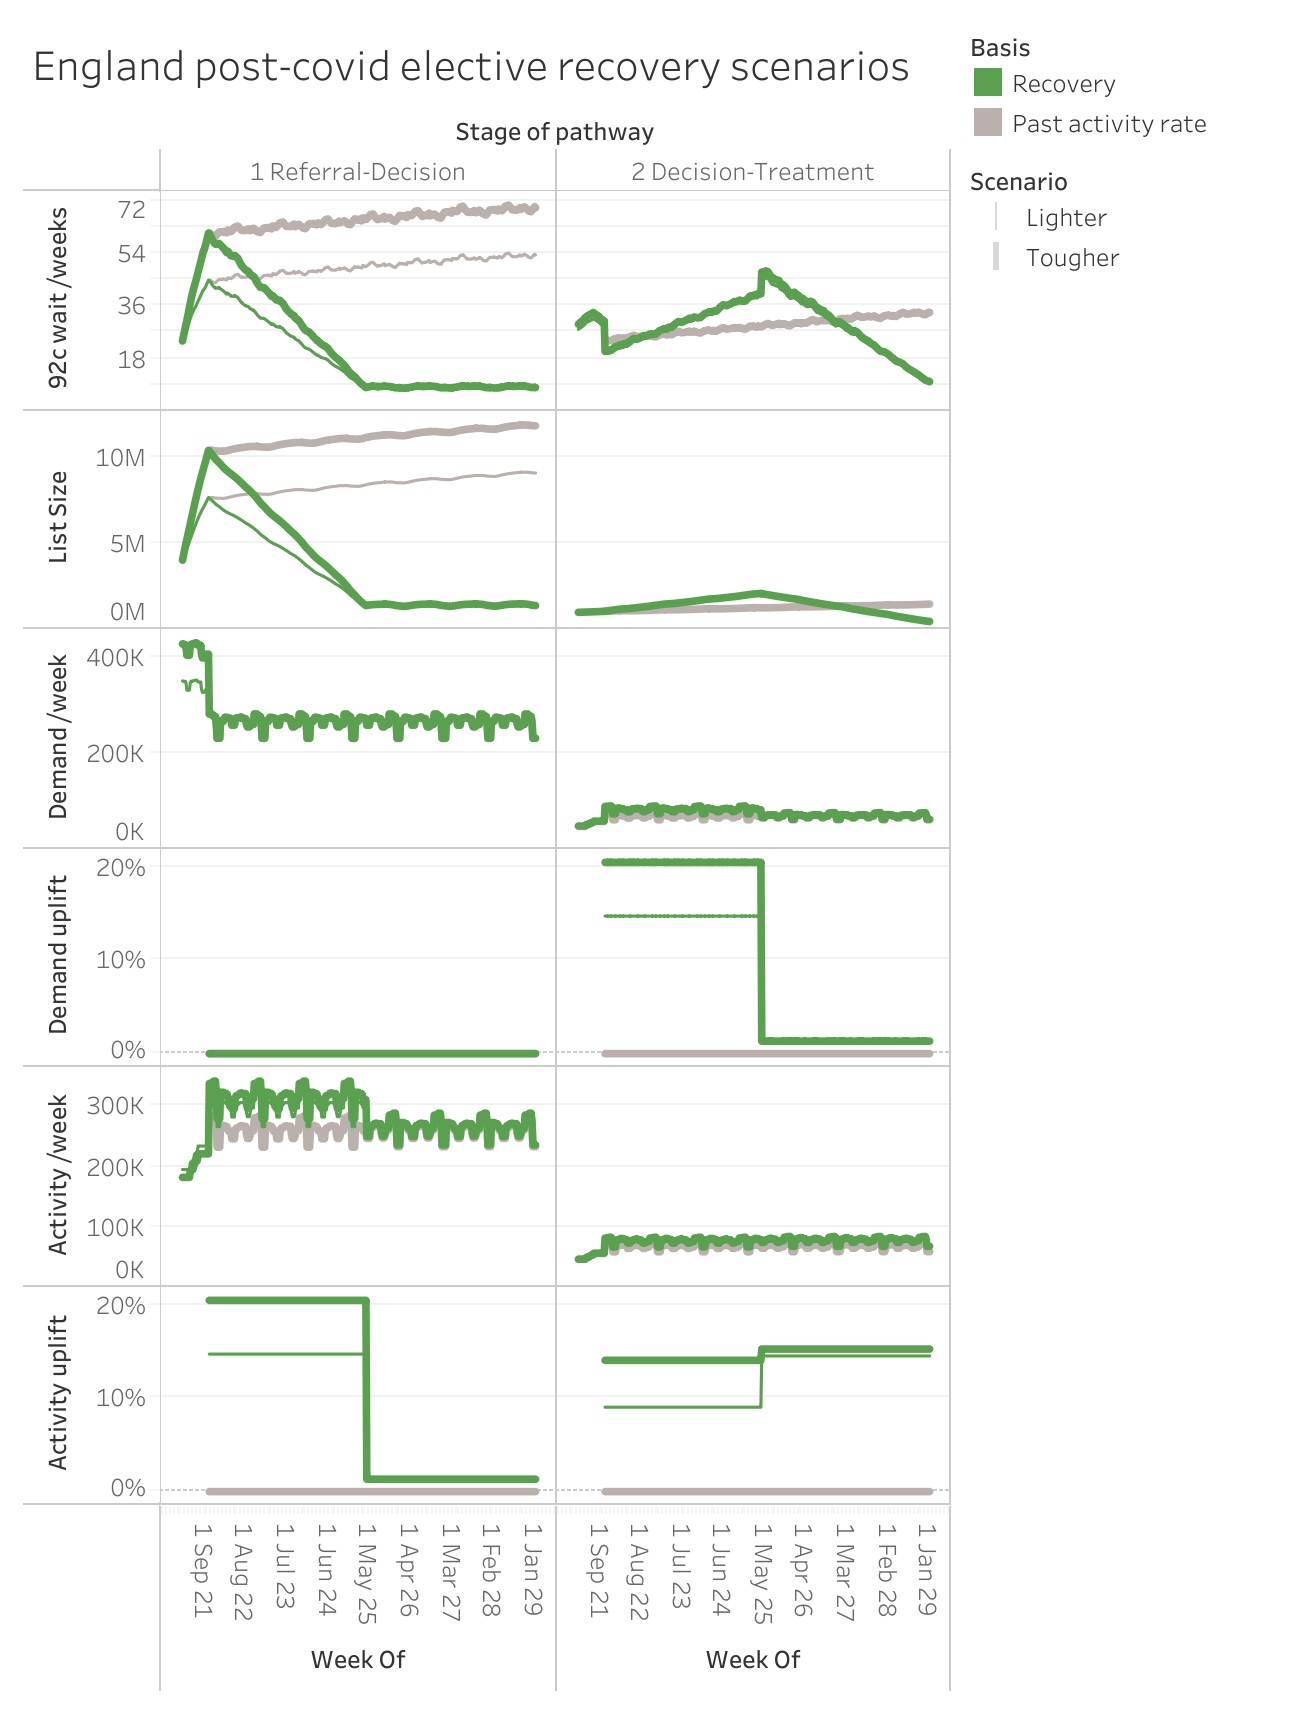
Here are the scenarios in chart form (also on Tableau Public). The recovery scenarios are shown by the green thick {thin} lines, with the no-recovery “business as usual” comparisons shown in grey. The ‘uplift’ charts show how much higher demand and activity are in phases two and three, compared with 2019 levels.
The detail
For those of you who like getting into the numbers, here they are.
The method used to split the published RTT data into Referral-Decision and Decision-Treatment data for the modelling is explained here.
For each month since serious covid restrictions began in March 2020, missing referrals were calculated by subtracting the actual number of clock starts from the equivalent calendar month in 2019. In the tougher scenario, 15 per cent were assumed to be removed without being seen or treated, with a further 20 per cent not returning, giving 68 per cent of missing referrals returning overall. The lighter scenario halves that number to 34 per cent.
The sums are laid out in this spreadsheet, to create the data needed as inputs into Gooroo Planner. There were further calculations to derive the seasonal variation in demand and activity, and to calculate the activity values for April to September 2021. The ‘tougher’ scenario is also available for each trust and specialty here (using waiting times as calculated by Gooroo Planner).
The waiting times in this England-wide analysis were not calculated by Gooroo Planner. The reason is that Gooroo Planner’s waiting time calculations are based on study of single waiting lists, such as those found within individual hospital specialties and subspecialties, whereas England’s waiting lists are the sum of thousands of local waiting lists. So we need to look at what is achievable in real life. In the years before covid, the NHS sustained waiting times better than 190 per cent of (list size / clock start rate), so that relationship is used for waiting lists and waiting times here. (As it happens the results were reasonably close to the waiting times calculated by Gooroo Planner anyway, using observed proportions of patients being seen and treated quickly.)
You can add the Referral-Decision and Decision-Treatment waits in this analysis to get RTT waits under a split target. But if there were no separate protections for those two stages of the pathway, then patients would arrive at Decision with a wide range of waiting times, so the two waiting times would not add, and achievable RTT waits would be shorter for any given size of RTT waiting list. Similarly the split waiting lists we need to achieve here are smaller than the combined RTT waiting lists when 18 weeks was being achieved over a decade ago. Although a split target is harder to achieve, there are (as noted above) many benefits because it protects waiting times to diagnosis and decision, and greatly simplifies and decentralises the planning and management of the most expensive stage of the pathway.