

After months of headlines about ultra long waiting times, you could be forgiven for thinking that covid had already hit the elective waiting list with full force. Unfortunately, it is only getting started.
The main problem so far has been covid restrictions on NHS activity. These have made it difficult for the NHS to treat urgent patients quickly enough, let alone tackle the longest waiting times. But all this time, pent-up demand has been building in the community as patients kept away from the NHS during the pandemic. It is this pent-up demand that is now showing signs of coming back.
In the coming months some apparently contradictory things may happen.
The waiting list is likely to grow very rapidly, as millions of patients come back to the NHS while it is still struggling to restore activity. It will look from the waiting list as though things are getting worse.
At the same time, the NHS will catch up on treating urgent patients and may be able to start treating many of the longest-waiters. It may look from the number of one-year waiters as though things are getting better.
The growing waiting list will be telling the truth, not the rise in one-year waiters. It is generally a mistake to focus too closely on the numbers waiting longer than some arbitrary waiting time threshold, and that will be especially true this year. As patients come back to the NHS, they will do so with zero time on the clock, so it takes a whole year for them to show up in the count of 52 week waiters.
In the meantime the swelling waiting list will be telling us that activity is not keeping up with demand. Until activity exceeds demand (which was not happening even before covid) the elective recovery will not have begun.
In the following discussion, all figures come from NHS England and NHS Improvement. If you have a national statistic that you’d like to check up on, you can download our waiting times fact checker.
England-wide picture
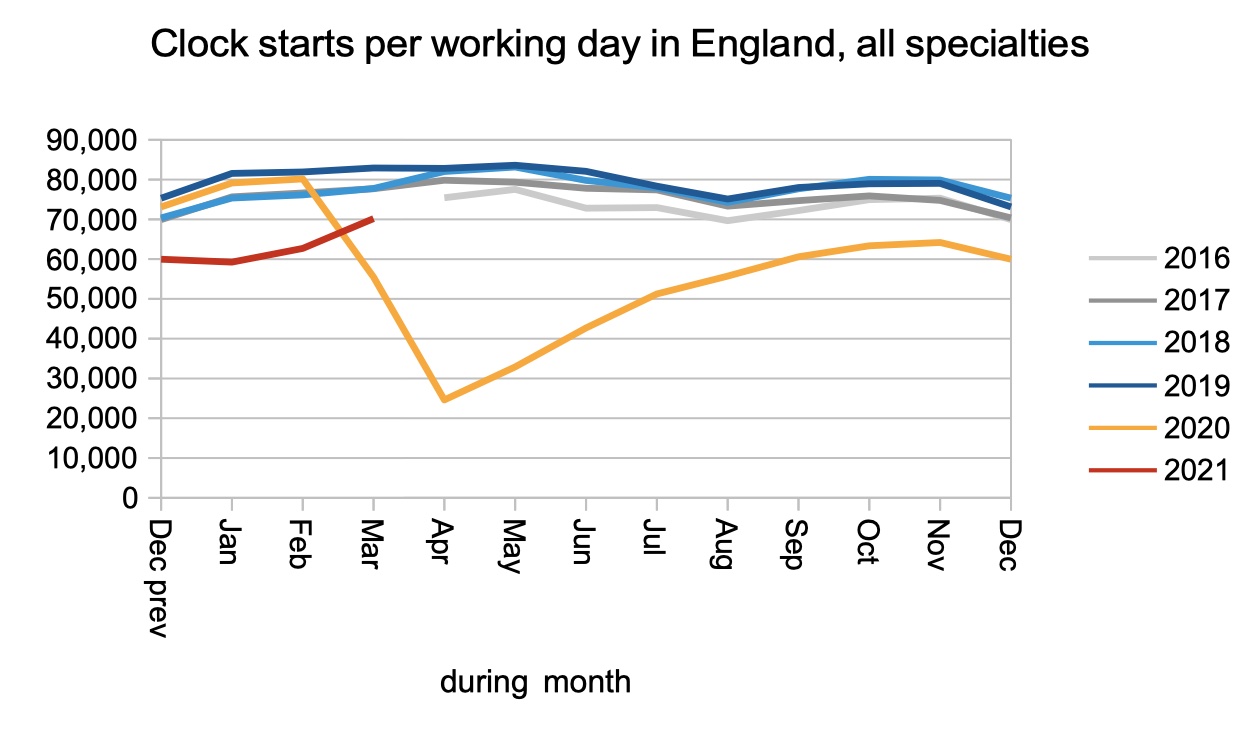
For the first time since covid restrictions started, the number of new referrals onto the waiting list (clock starts) was higher than the year before. The gap between current referral rates and the pre-covid years also narrowed significantly.
So it looks as though the demand for elective care is beginning to recover after covid. This is not yet the expected surge of pent-up demand – that will only happen when clock starts are higher than the pre-covid years – but it an early sign that demand is recovering.
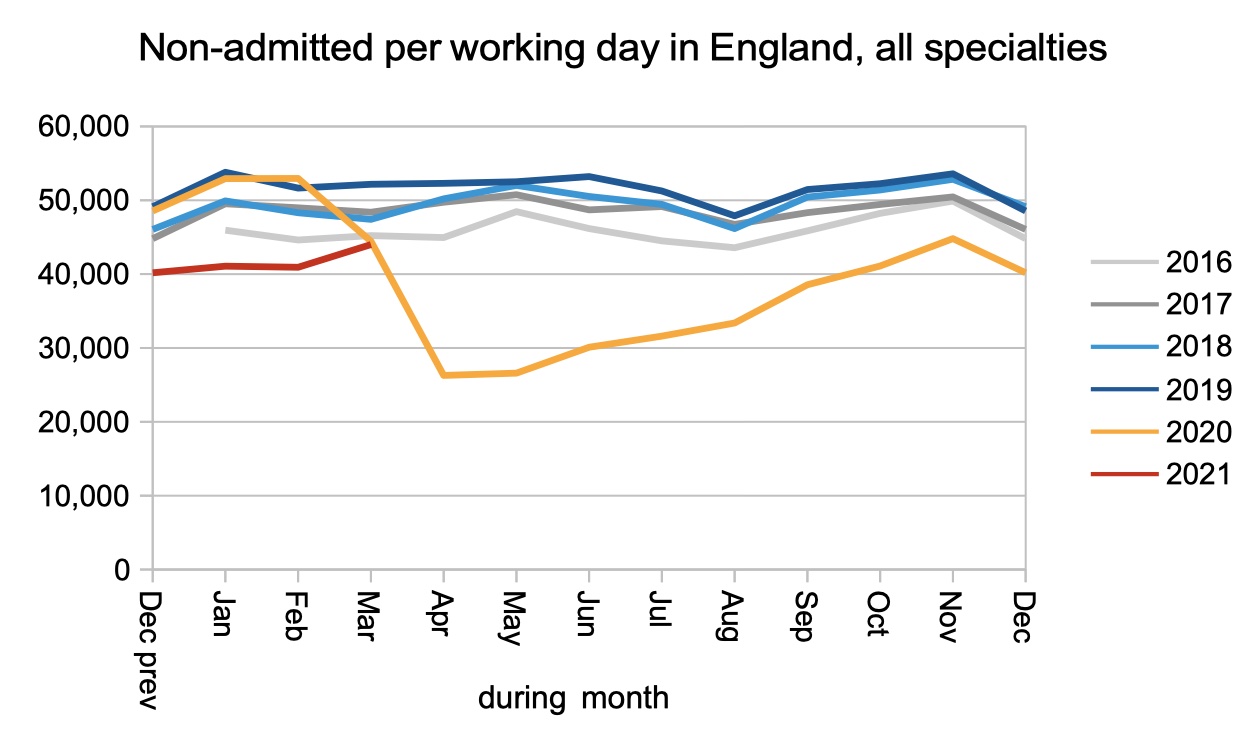
While referrals were higher than last year, the rate that patients were discharged from clinic (non-admitted clock stops, in the jargon) was exactly the same as last year, and still below pre-covid levels.
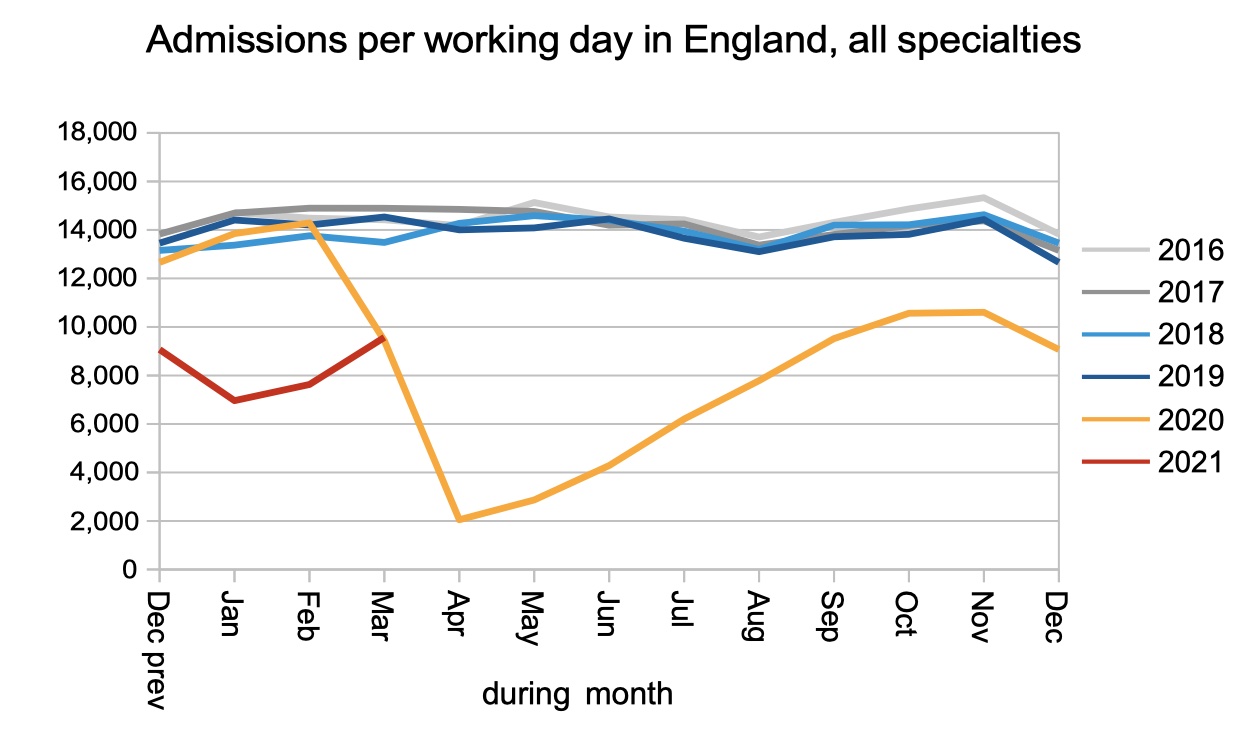
Similarly, admissions recovered to match the rate of last March, well below pre-covid levels.
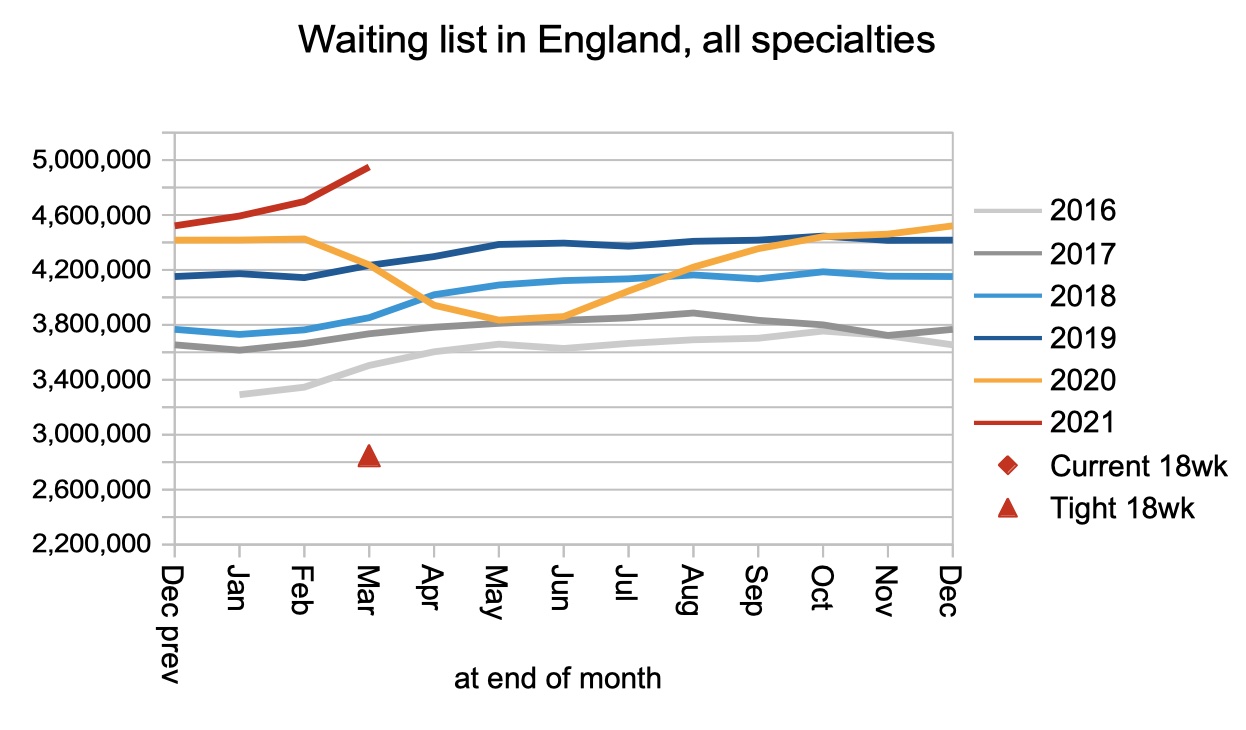
With demand higher than last year, and activity the same as last year, the waiting list grew sharply. (About a quarter of the increase is an artefact of the Royal Free London NHS Foundation Trust returning to RTT reporting.)
Broadly speaking, a growing waiting list means that the NHS is not keeping up with elective demand and things are getting worse. The elective recovery will only be underway when waiting lists and waiting times are shrinking.
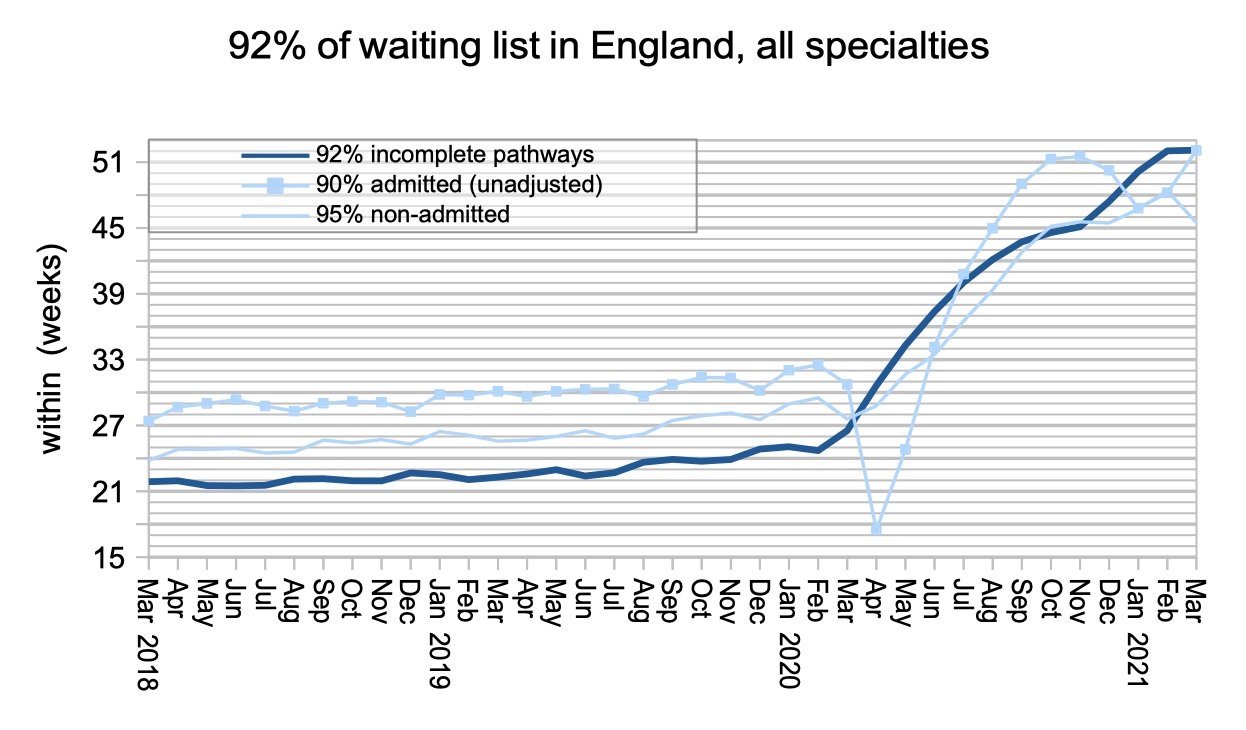
We cannot tell what is happening to waiting times at the moment because they are maxed out at “52 plus” weeks. This will be corrected in next month’s data, which will go up to “104 plus” weeks.
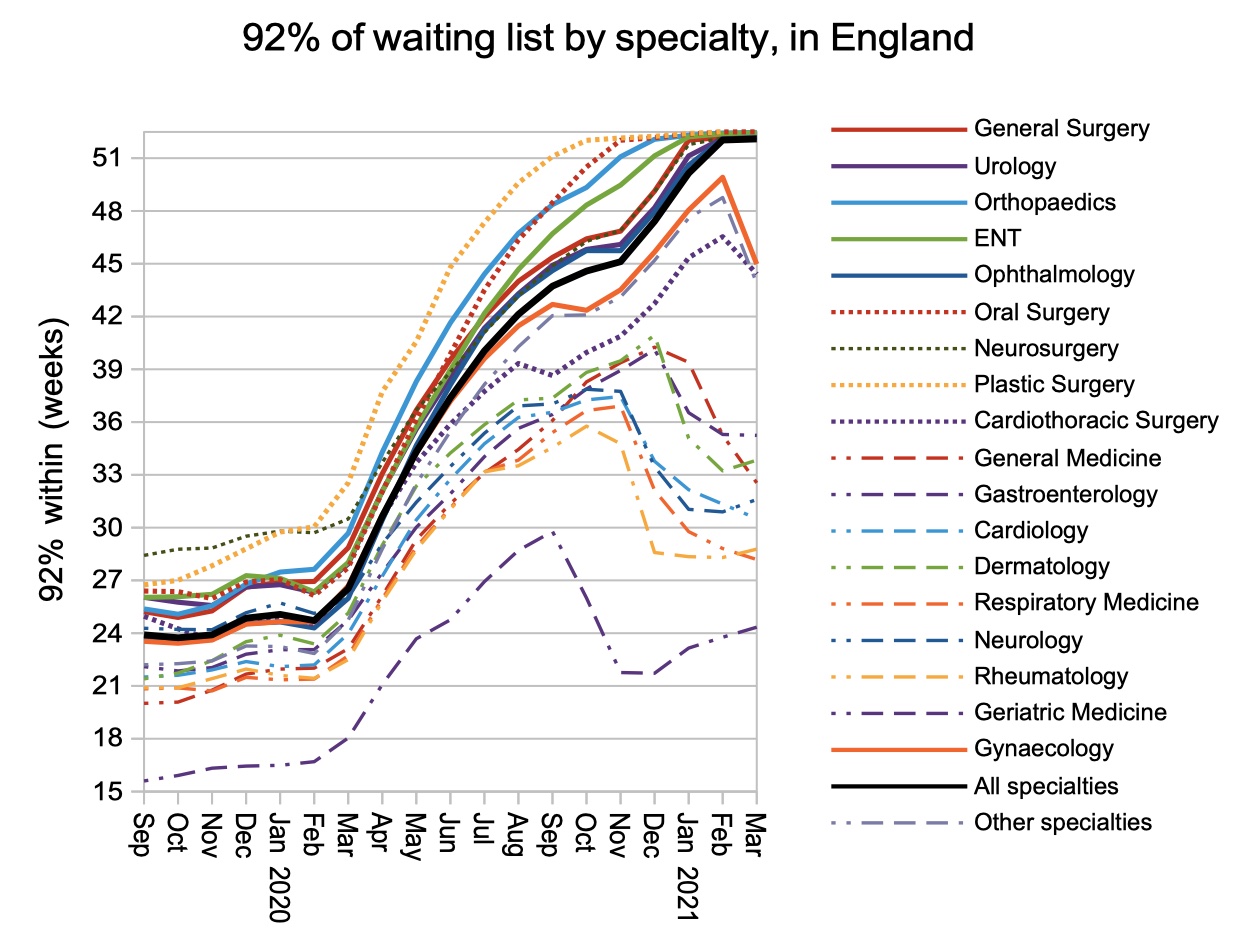
Most surgical specialties are maxed out at 52 weeks plus. Waiting times are better in medical specialties, which are more clinic-based and have higher proportions of urgent patients in the casemix.
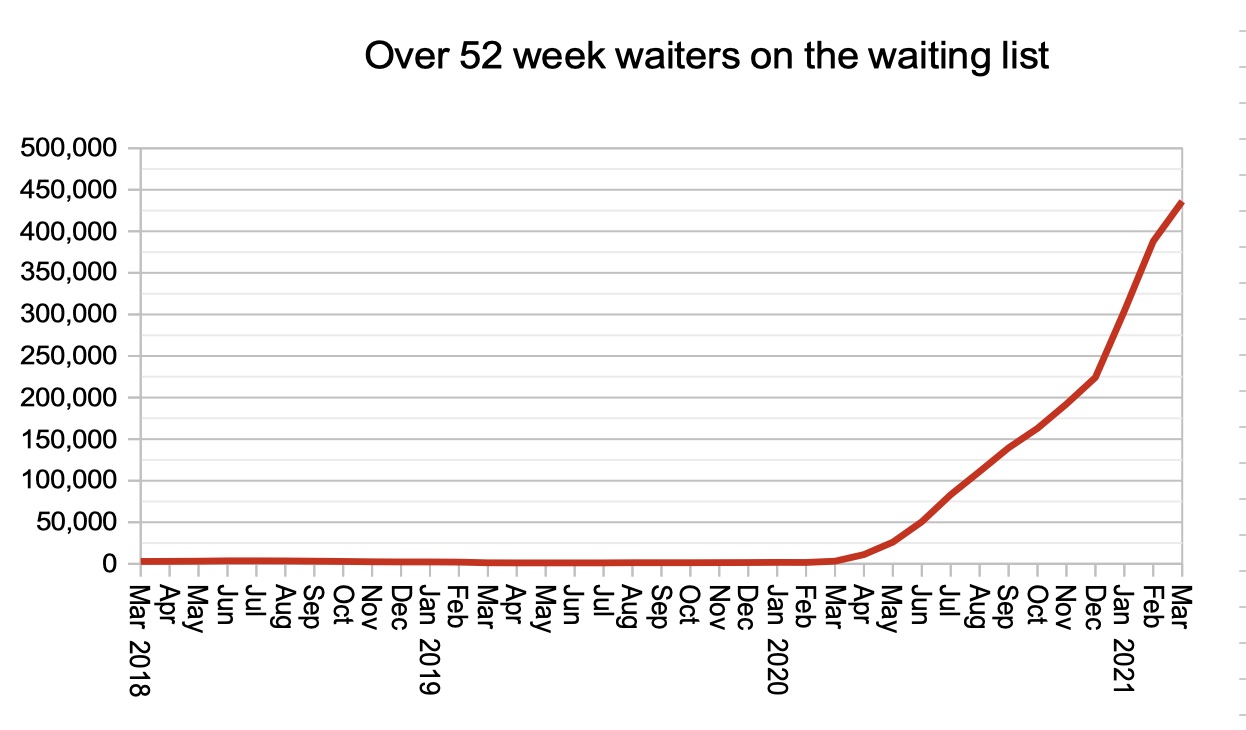
The number of one year waiters continued to rise rapidly. However, as discussed above, this chart will not tell the true story of growing waiting time pressures in the coming months.
Local picture
Is this an early indication that one-year waiters are approaching their peak? The lull in referrals during the first covid shutdown is starting to reach its anniversary, so fewer patients will tip over the 52 week mark in the coming months.
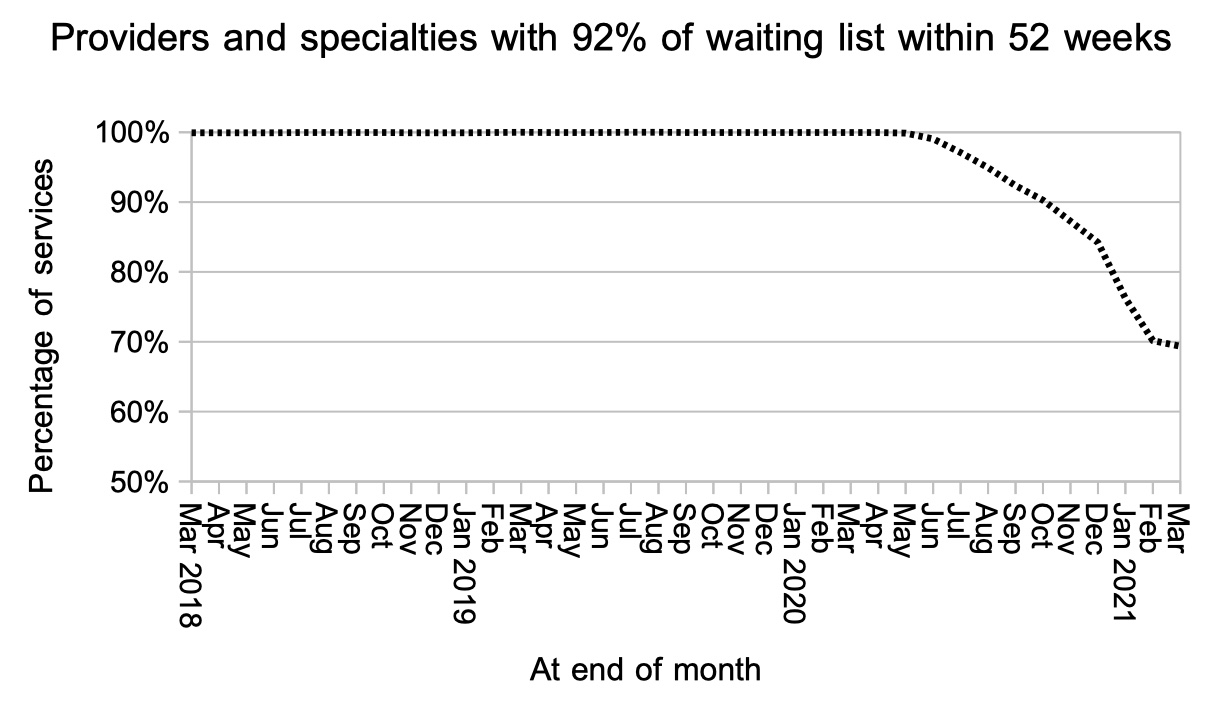
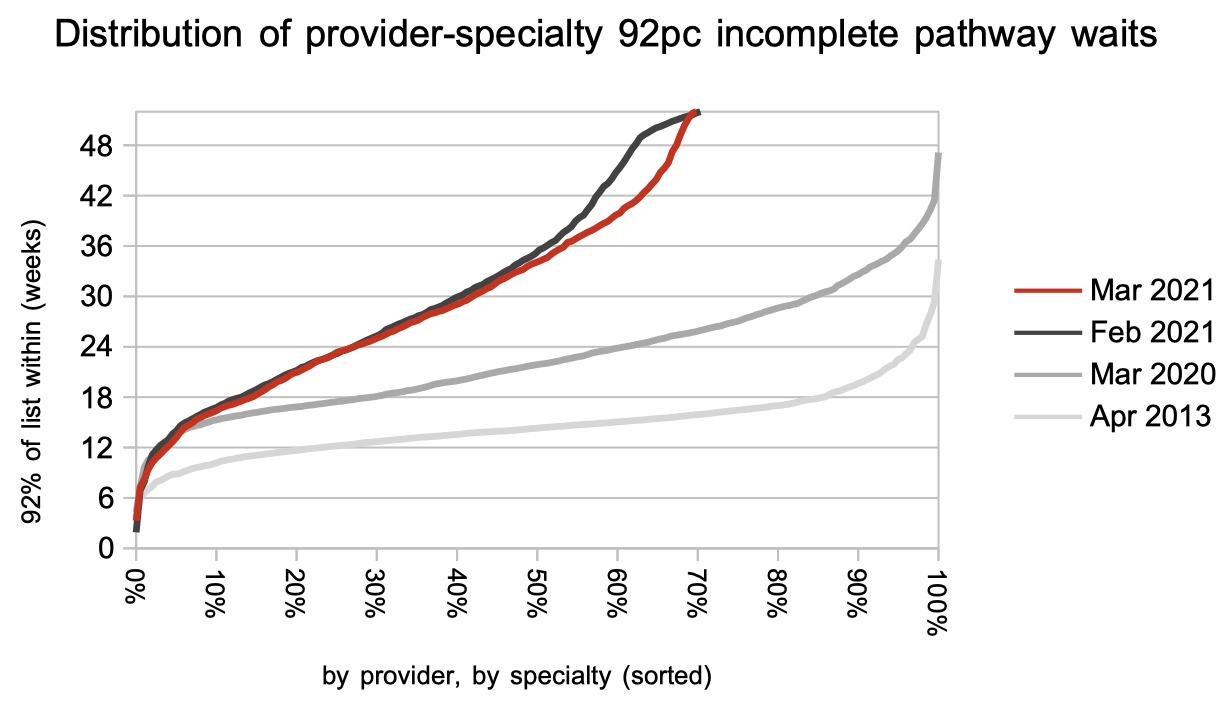
The distribution of local waiting times has improved, in another possible indication that a reduction in 52 week waiters is approaching. The improvement is concentrated at roughly the number of weeks that have passed since the first covid shutdown.
Referral-to-treatment data for April 2021, including a breakdown of waits up to 104 weeks and a breakdown of the “Other” specialty, is due out at 9:30am on Thursday 10th June 2021. Analysis is likely to take longer that day, because all the published tables will have a different layout to accommodate the new data.