

NHS England’s Phase Three letter at the end of July called for “Accelerating the return to near-normal levels of non-Covid health services, making full use of the capacity available in the ‘window of opportunity’ between now and winter”.
Their monitoring data suggested that in September this recovery went well, but the ‘window of opportunity’ then began to close as hospitals began filling up with covid patients again in October.
So if September was as good as it’s going to get for a while, was it enough to stop the rapid rise in elective waiting times? Unfortunately not.
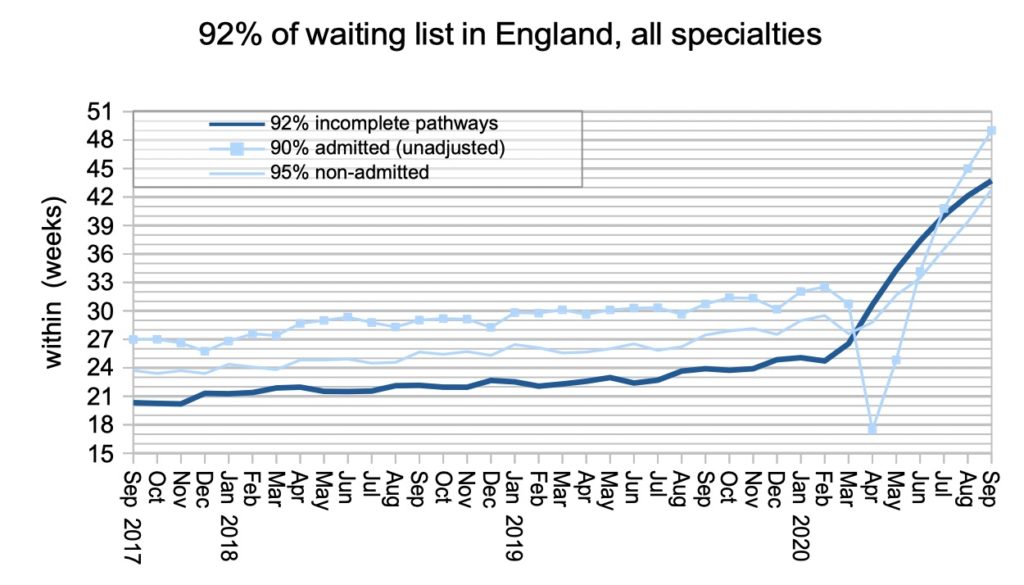
During September, England’s waiting times rose by 1.6 weeks. That was an improvement over August (up 2.1 weeks), and much better than the depths of the covid shutdown (up 4.1 weeks in April). But a rise of 1.6 weeks in a single month is still rapid.
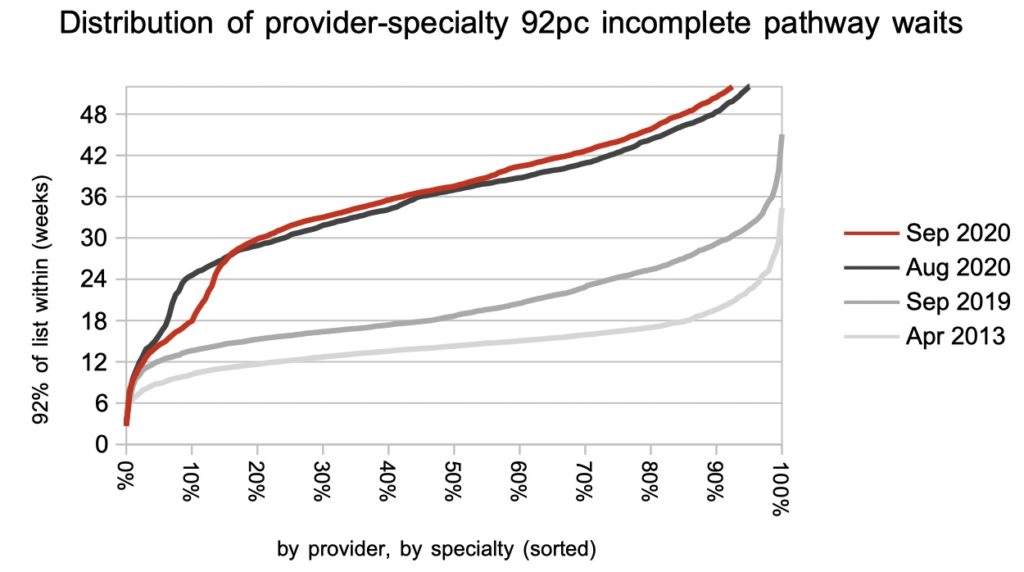
The statutory target is for 92 per cent of the RTT waiting list to be within 18 weeks. This target was breached in 2016 and waits have been rising very rapidly this year because of covid. At the end of September, England had reached 43.7 weeks.
With waiting times so high, and rising so rapidly, it will not be long before England exceeds the iconic waiting time of 52 weeks.
In the following discussion, all figures come from NHS England and NHS Improvement. If you have a national statistic that you’d like to check up on, you can download our waiting times fact checker.
For analysis of waiting times performance at a particular organisation, visit our reports page. You can also access maps of the latest waiting times across England for A&E, cancer, and RTT.
England-wide picture
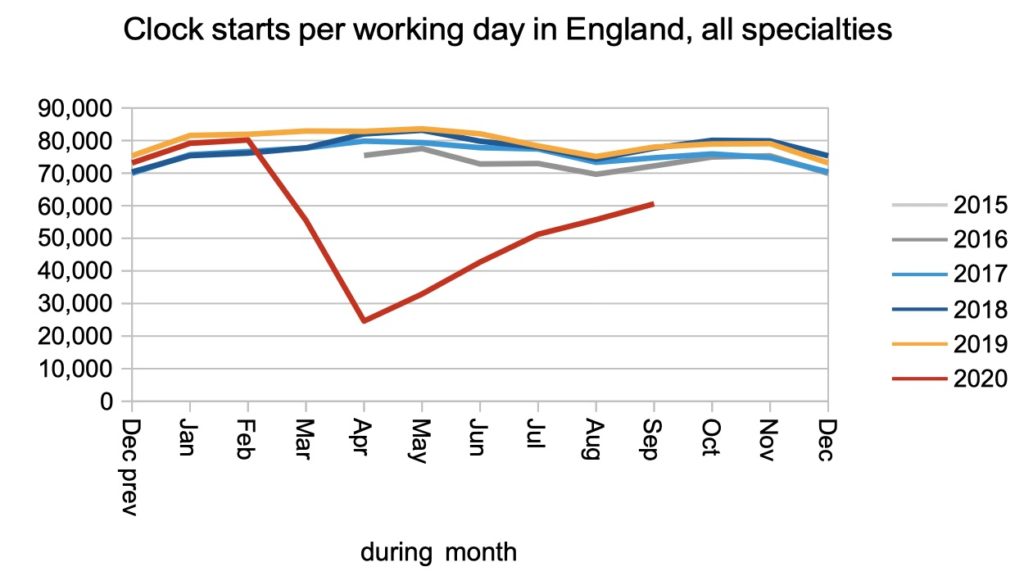
Clock starts are triggered when patients are referred to a consultant-led service, so the continued increase in clock starts shows that primary care is getting back to business in these difficult times. However referral rates remain below pre-covid levels, and that gap is a sign that pent-up demand is continuing to accumulate in the community.
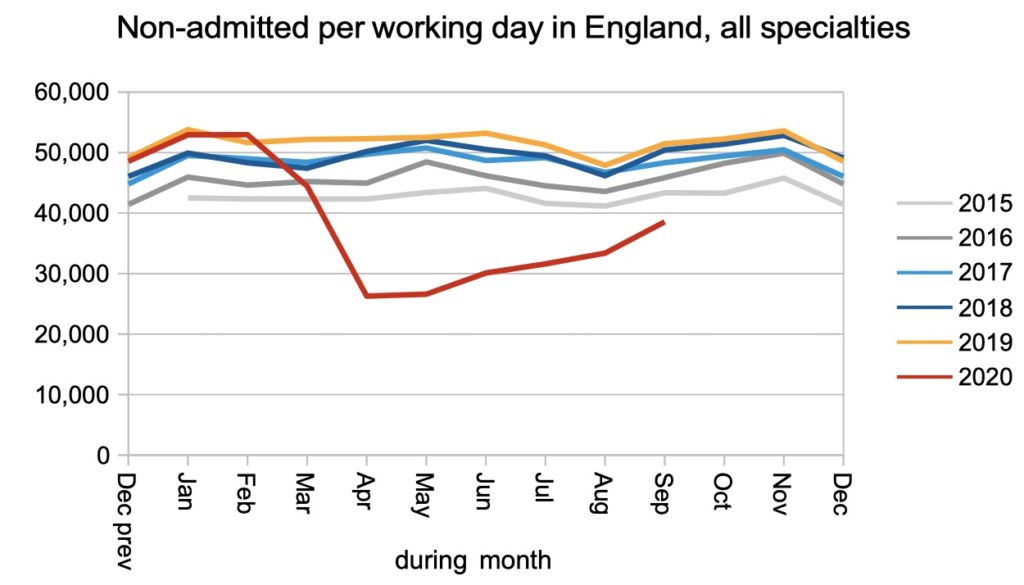
Non-admitted clock stops (patients discharged from outpatients or without being seen) also increased, but also remained somewhat below pre-covid levels.
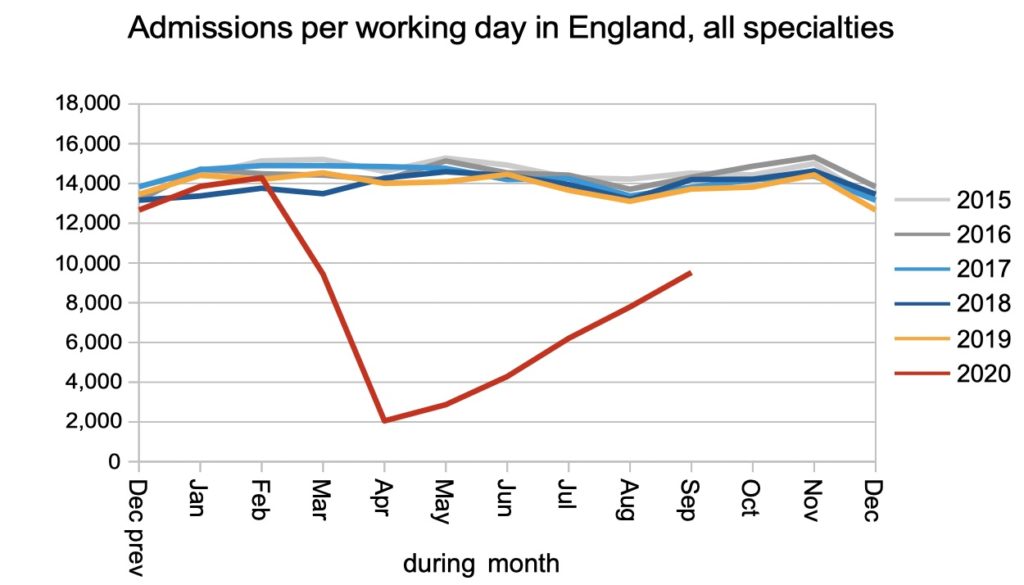
Admissions for inpatient or daycase care also increased to a creditable proportion of pre-covid activity (though once again, still below it).
The change in the waiting list shows us whether the huge reduction in referrals outweighed the huge reduction in clock stops. It did at the start of the covid shutdown, but not any more. And as noted above, the waiting list does not represent the true backlog because of the large amounts of pent-up demand that continue to accumulate in the community.
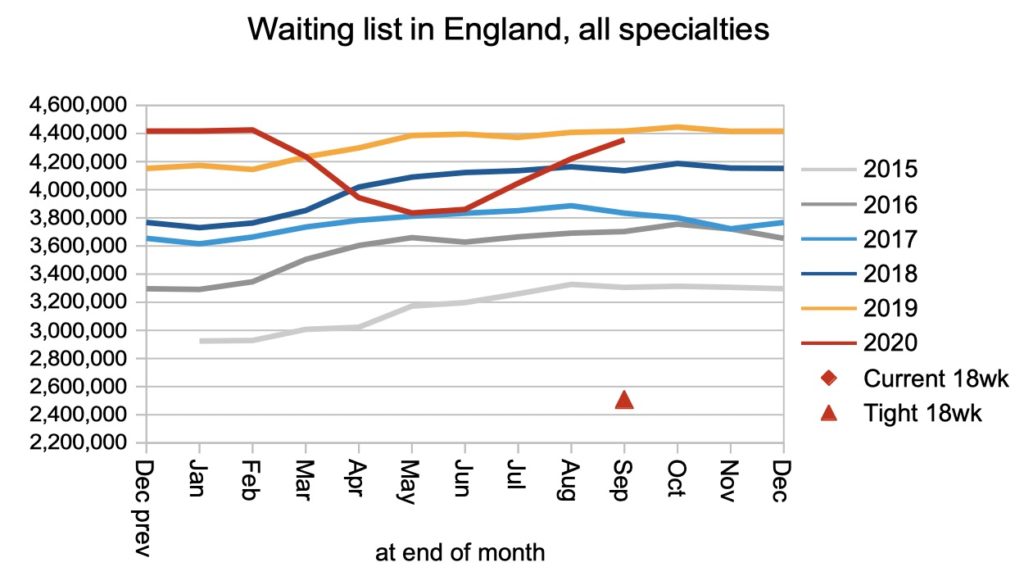
Waiting times continued to grow rapidly, just not quite as rapidly as during the depths of the covid shutdown. We are now approaching the iconic 52 week threshold where the published data stops. NHS England are collecting data on 78 week and 104 week waiters now, and it would be useful if they could be included in the published data soon.
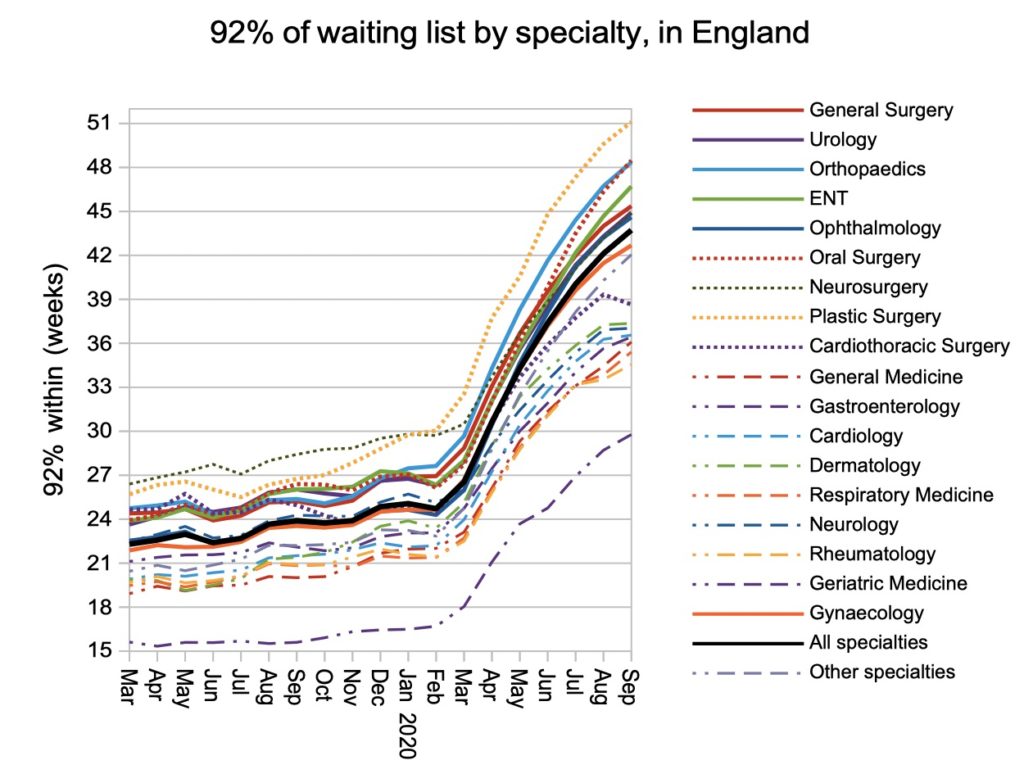
The rise in waiting times is being felt fairly evenly by the larger surgical specialties, although cardiothoracic surgery saw an improvement in September and some medical specialties held their position.
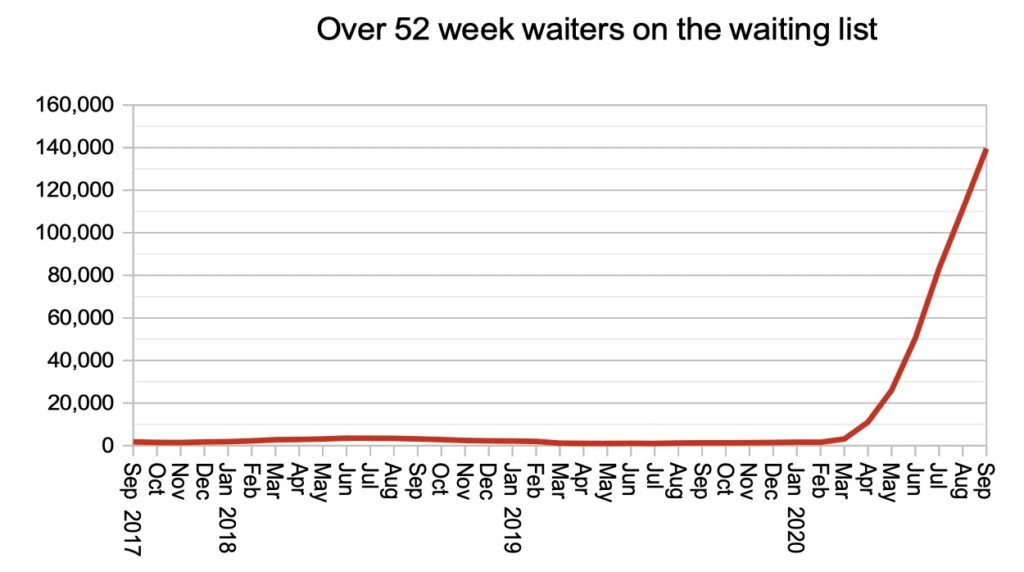
The number of patients tipping over the 52 week mark continued to soar. Although the number of patients waiting longer than a certain threshold is the NHS’s preferred style of monitoring, the length of time that patients are waiting is of greater relevance to patients and more responsive to the changing situation. (Which is why I prefer to monitor times in the charts above.)
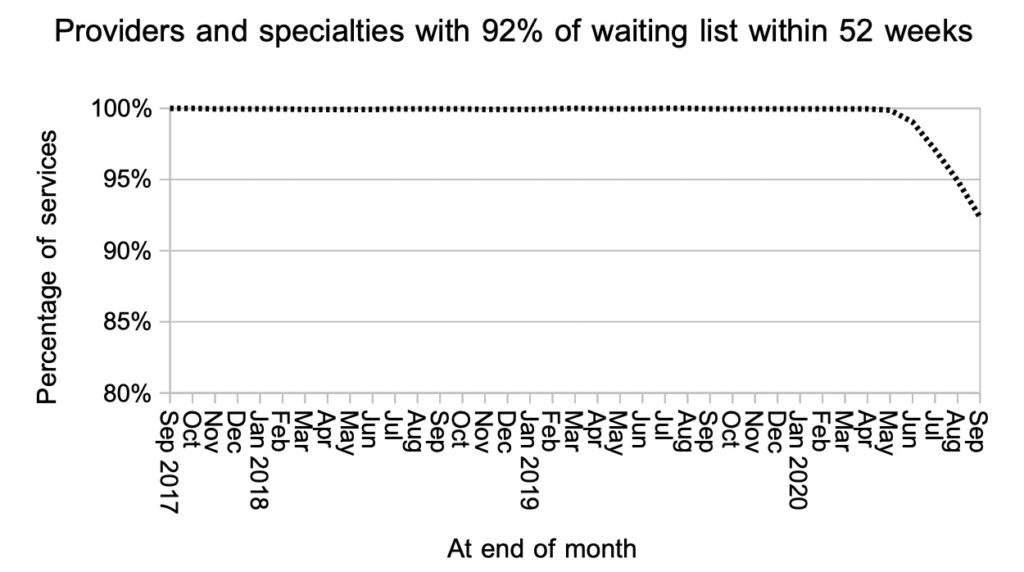
Looking at the thousands of individual specialties within hospitals, the proportion achieving 52 weeks continues to decline.
The distribution of local waiting times shows that local specialties continue to make the effort to achieve 18 weeks where that is within striking distance. For most, however, the picture is of high and relentlessly rising waiting times.
Referral-to-treatment data for October 2020 is due out at 9:30am on Thursday 10th December.