

Elective admissions rose sharply following the relaxation of covid measures, but it was not enough to stop the waiting list from growing
Analysis produced for Health Service Journal by Dr Rob Findlay, Director of Strategic Solutions at Insource Ltd and founder of Gooroo Ltd
May was the first full month since covid infection prevention and control measures were eased in the English NHS, and both elective activity and demand went up. The biggest increase was in elective inpatient and daycase admissions – the areas that had been most affected by covid measures because there is no alternative to patients physically attending hospital.
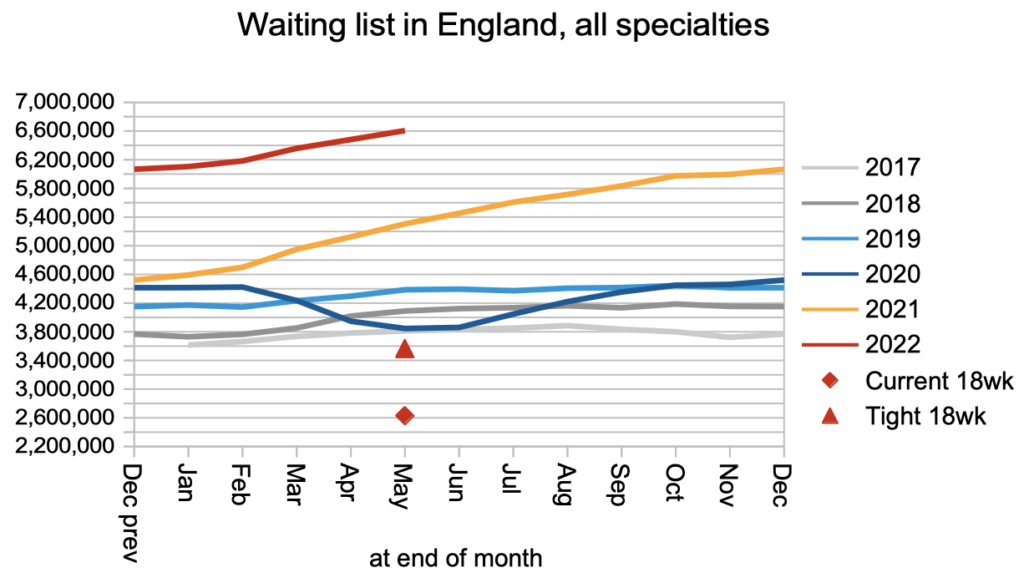
Waiting lists grow when patients are being added to the list faster than they are treated and discharged from it. So, if treatments and discharges increased in May, was that enough to stop the list from growing? Unfortunately, it wasn’t. Patients were added to the waiting list faster as well, with the net result that the waiting list continued the rapid growth that began over a year ago.
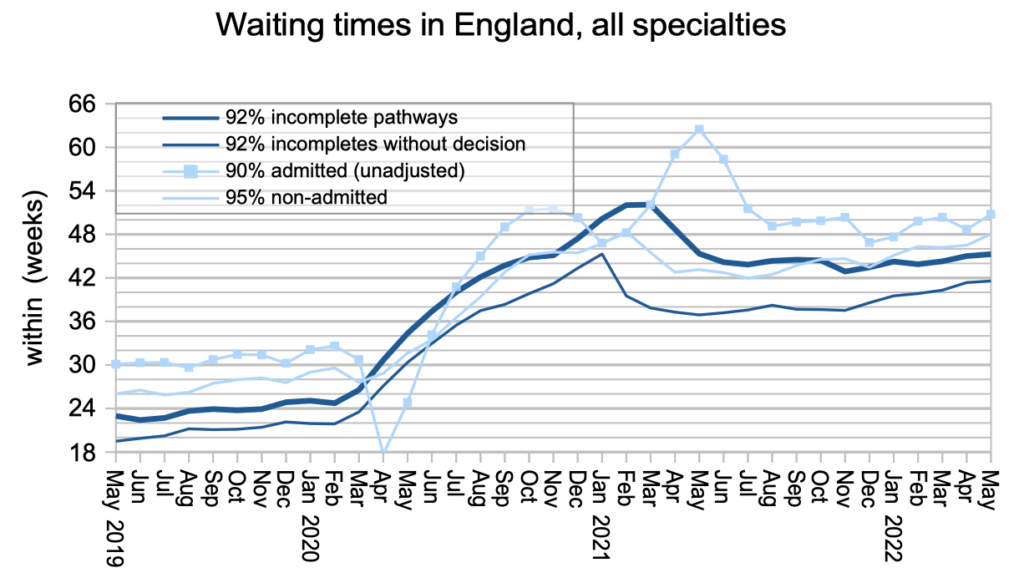
These increasing volumes are a welcome sign that patients who need elective care are seeking it, and the NHS is increasingly able to respond. However, there is still a huge and growing backlog, and the waiting time just to diagnosis and decision has edged up to 41.6 weeks (9.6 months), which is a very long time if you have an undetected urgent condition like cancer.
Media coverage will rightly cheer the fall in patients waiting longer than two years (104 weeks) from 12,735 to 8,028 during May. This matters because it is risky and unfair for small numbers of patients to be kept waiting longer than two years, when most patients are treated much faster. But the bigger ambition is rightly to reduce waiting times for all patients, and that is currently in doubt because the underlying pressures remain relentlessly in the opposite direction.
In the following discussion, all figures come from NHS England statistics. If you have a national statistic that you’d like to check up on, you can download our waiting times fact checker.xls.
The numbers
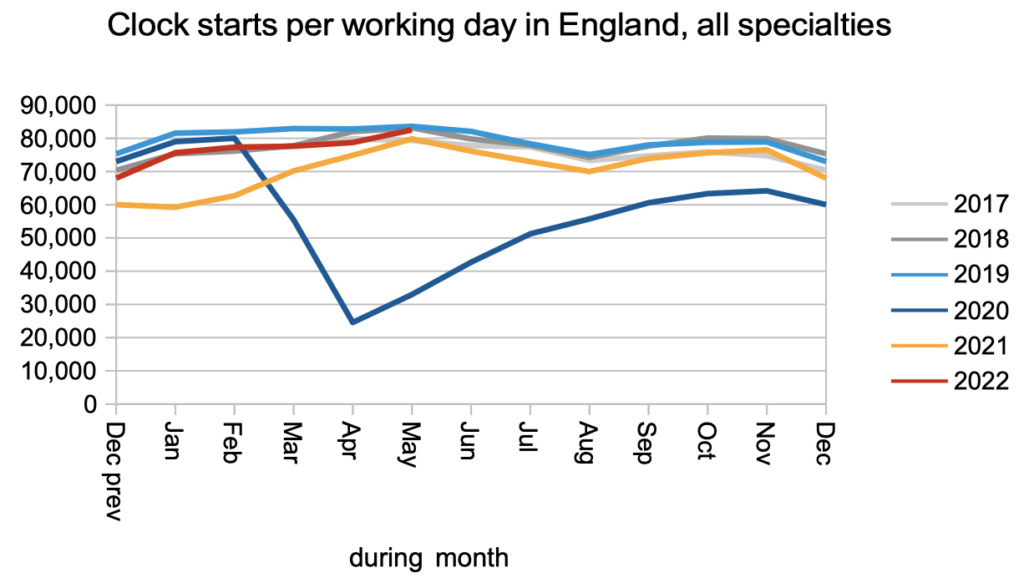
The demand for elective care (measured here by patients starting new waiting time ‘clocks’) edged up in May, effectively reaching pre-pandemic levels for the first time.
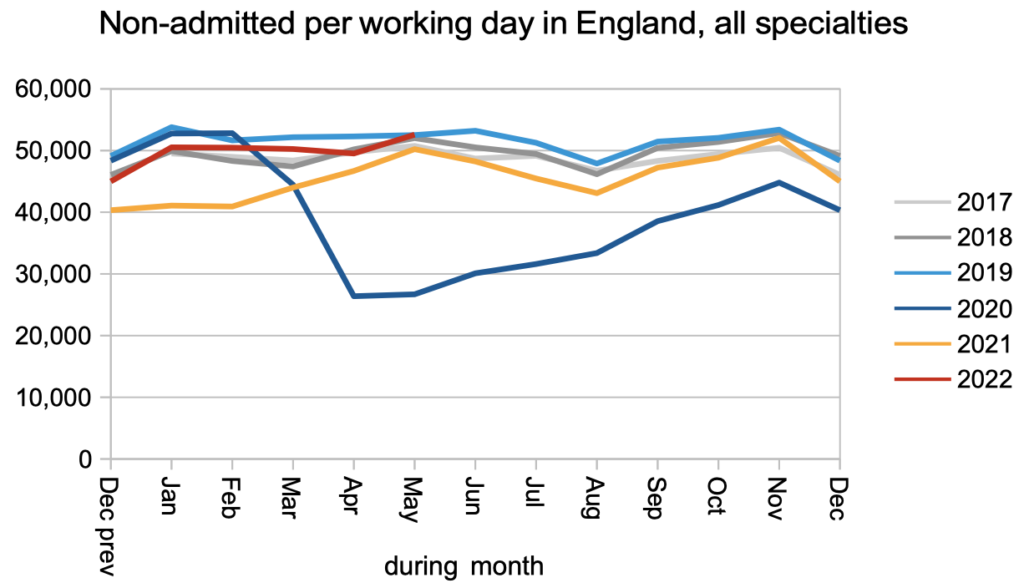
The same happened with non-admitted clock stops, which counts patients who are treated and discharged without being admitted, mostly from outpatients.
The biggest improvement was in patients admitted for treatment as inpatients and daycases. Covid infection prevention and control measures caused significant disruption to admissions because patients have to come into hospital for significant lengths of time, and covid measures were in place both for them and the staff who cared for them.
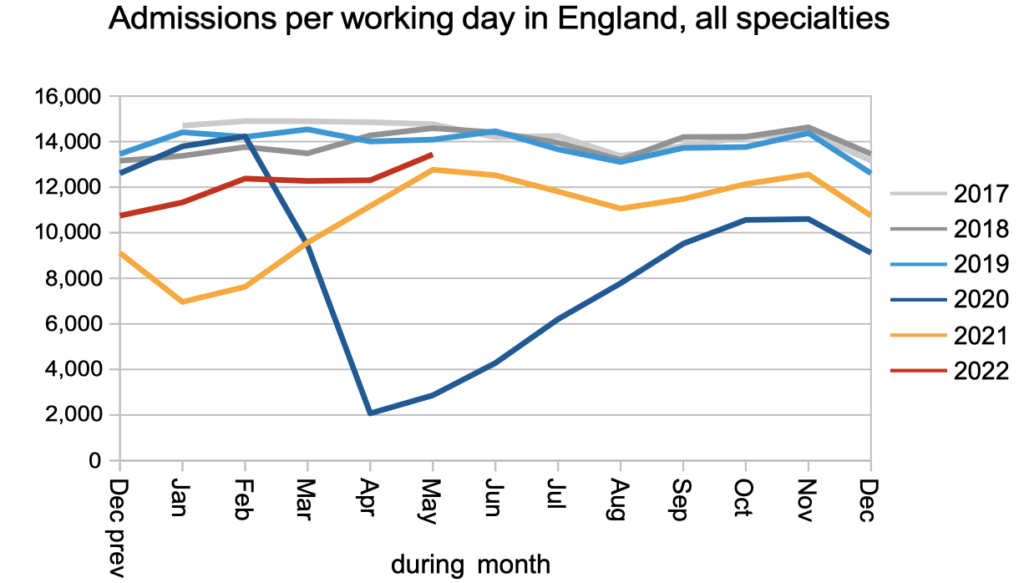
The waiting list was growing steadily even before covid. Now that demand and non-admitted activity have returned effectively to pre-covid levels, but admitted activity is still falling short, the net result is that the waiting list is still growing faster than pre-pandemic. This means that the underlying pressure on waiting times is increasing too.
Waiting times from referral to treatment duly increased from 45.0 to 45.3 weeks (10.4 months) across England. The wait to diagnosis and decision also increased from 41.4 to 41.6 weeks (9.6 months). (By the way, don’t use those numbers to try and calculate the waiting time from decision to treatment – these waiting time statistics do not add and subtract because patients reach decision to admit across a broad span of waiting times.)
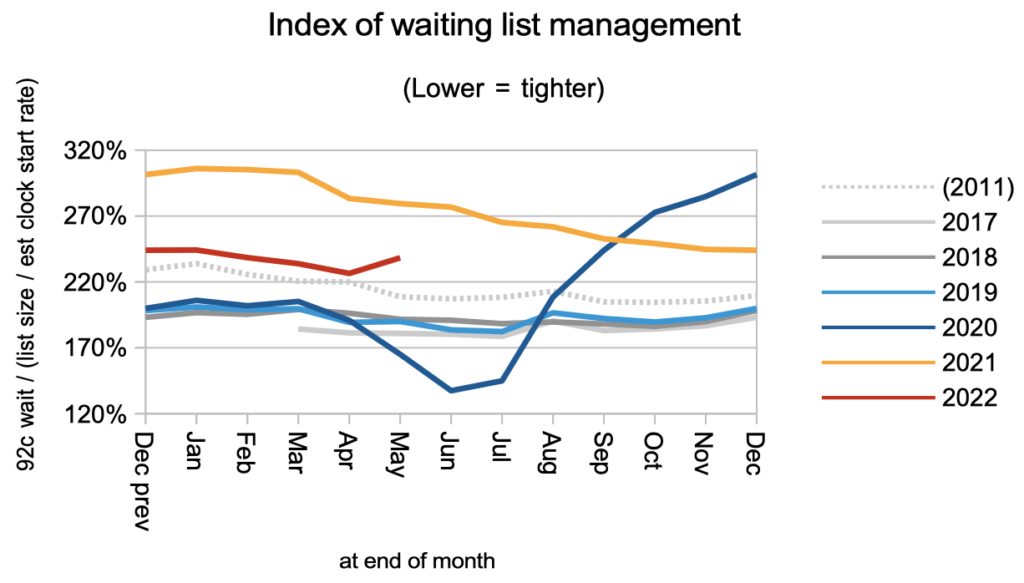
There was an unexpected deterioration in the shape of the waiting list, as shown by the uptick in the index of waiting list management. On looking more closely at the data, it seems that the anomaly was actually in April, when there were unusually few patients in the short-waiting cohorts on the waiting list. This affects the method I use to create a continuous time series for clock starts that goes back to 2011 (clock starts have only been published since April 2016). So we can still interpret this as a deterioration in the shape of the waiting list, but not necessarily one that happened suddenly in May.
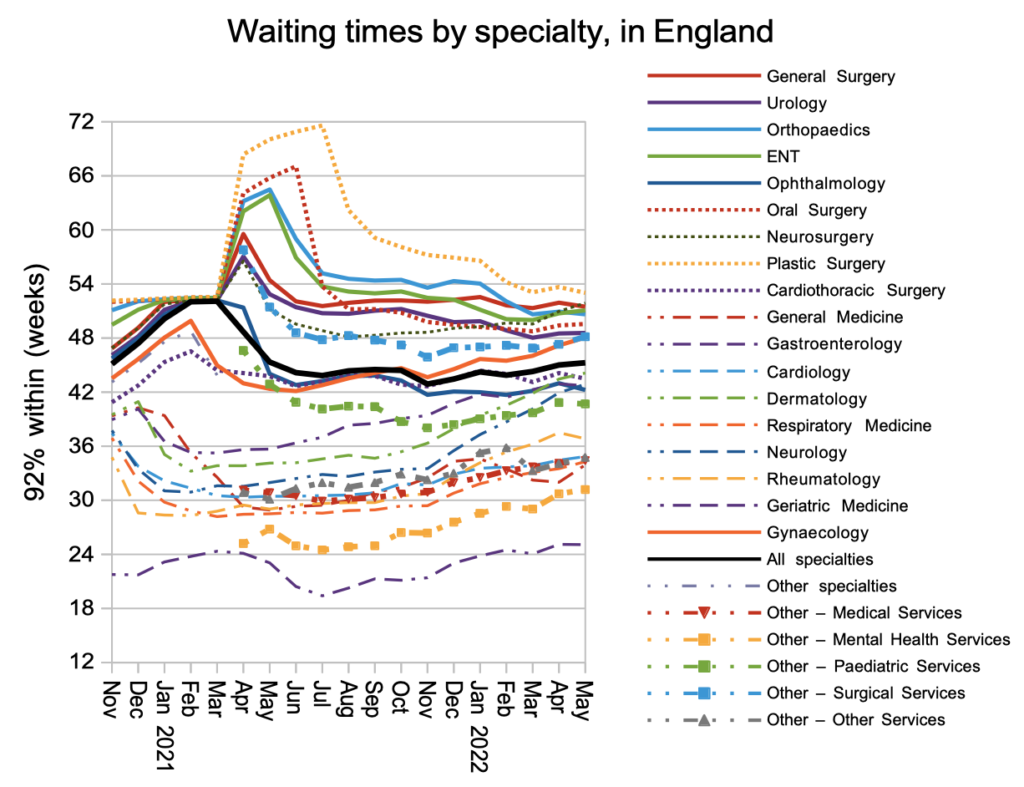
In general the specialties with the longest waiting times improved slightly, while those with shorter waiting times deteriorated. This might be a consequence of the current focus on eliminating the very longest waits.
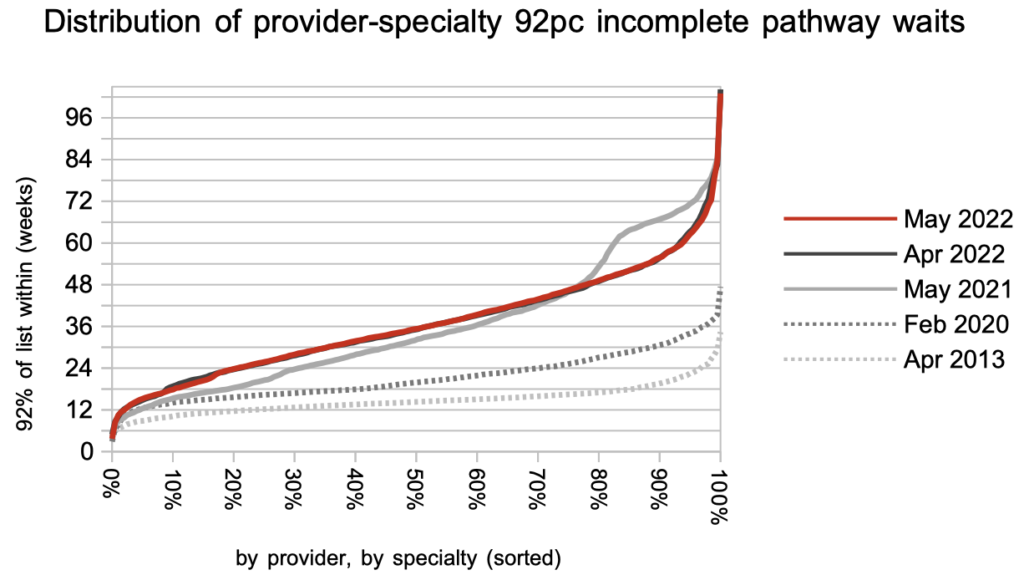
The distribution of local waiting times hardly changed during May. But just look at how much worse they are, than before the pandemic.
Referral-to-treatment data up to the end of June is due out at 9:30am on Thursday 11th August – see 12 month calendar.