

The English NHS fought a losing battle to keep up with elective demand in April, as the referral-to-treatment (RTT) waiting list reached a new record size of 7.4 million patient pathways. The Prime Minister’s New Year pledge that “NHS waiting lists will fall” remains out of reach.
Analysis produced for Health Service Journal by Dr Rob Findlay, Director of Strategic Solutions at Insource Ltd and founder of Gooroo Ltd
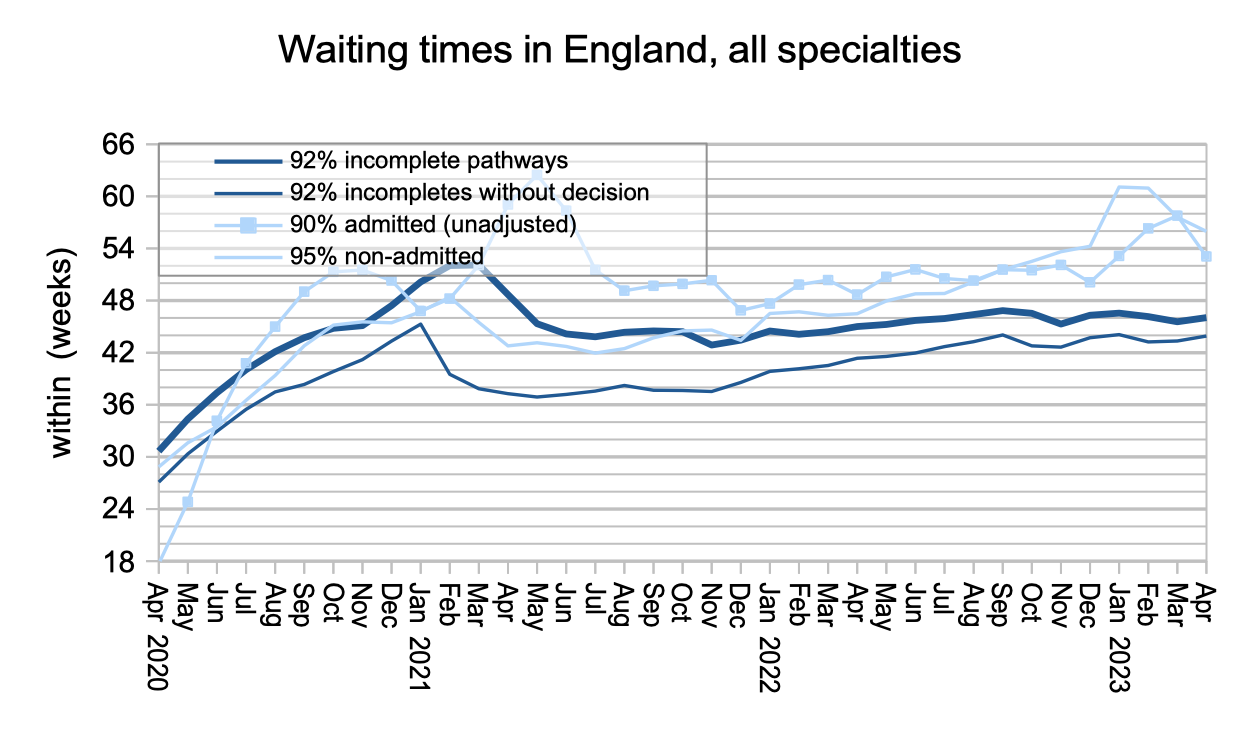
Most of that waiting list (6.3 million) have not yet reached diagnosis and decision to admit, and I estimate that includes about 26,800 patients who will eventually turn out to have cancer. They are not protected by the cancer waiting time targets because their cancer is not yet suspected, so they face the typical wait of 43.9 weeks to diagnosis and decision (up from 43.3 weeks in March), which is far too long when that diagnosis turns out to be cancer or another urgent condition.
Although outpatient waiting times (and hence waits to diagnosis) are rightly a focus for NHS England, the targets in this area are focused on something different: eliminating 65 week RTT waits by March 2024, and then 52 week waits a year later (after the next general election). New analysis for HSJ shows why these targets will be much tougher than the recently-missed target to eliminate 78 week waits, and you can see how your local services compare by clicking through the points on this map to the underlying analysis.
In the following discussion, all figures come from NHS England. For analysis of waiting times performance at a particular organisation, visit our reports page, or our map of the latest elective waiting times across England.
The numbers
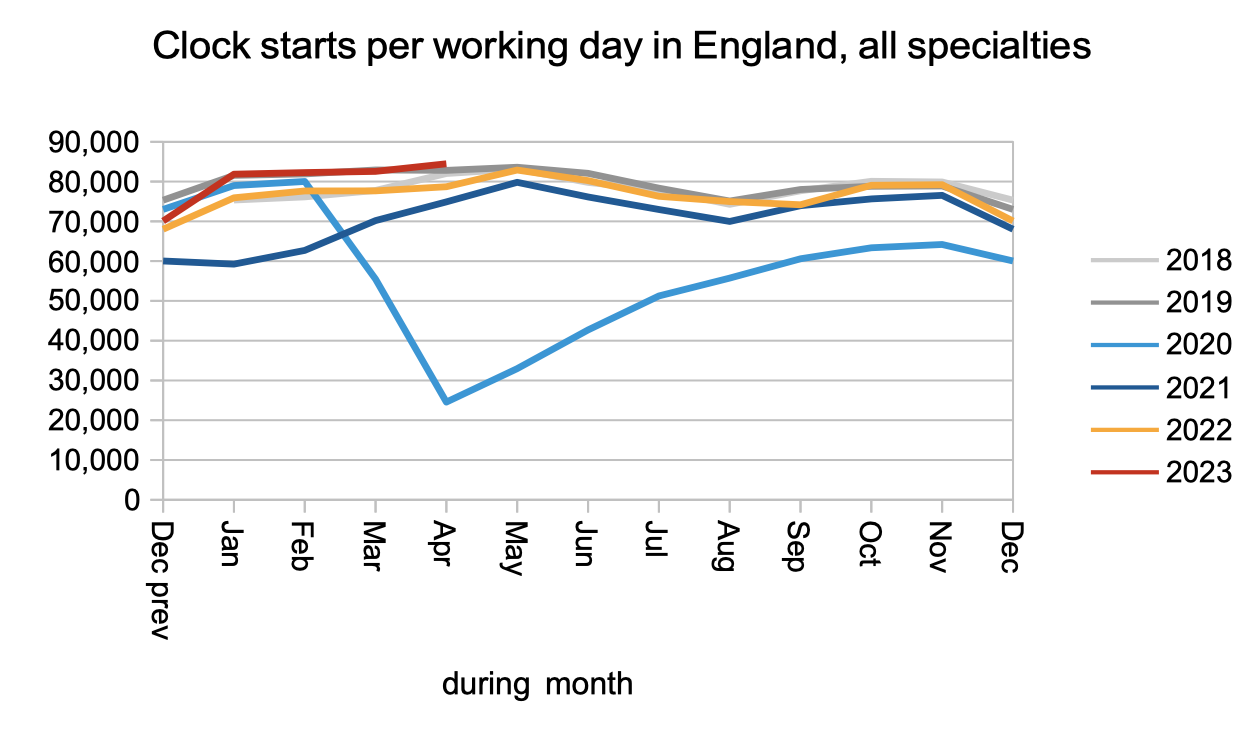
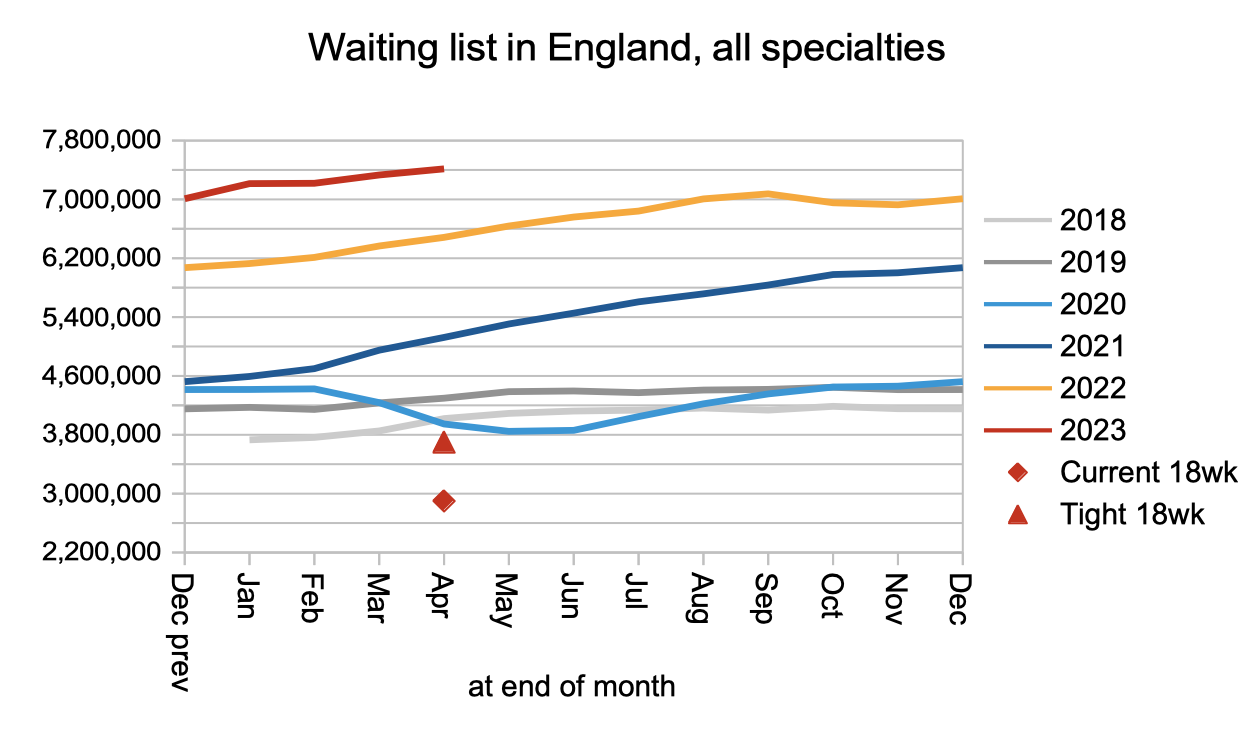
Demand, measured by patients starting new waiting time ‘clocks’, remained at pre-pandemic levels in April.
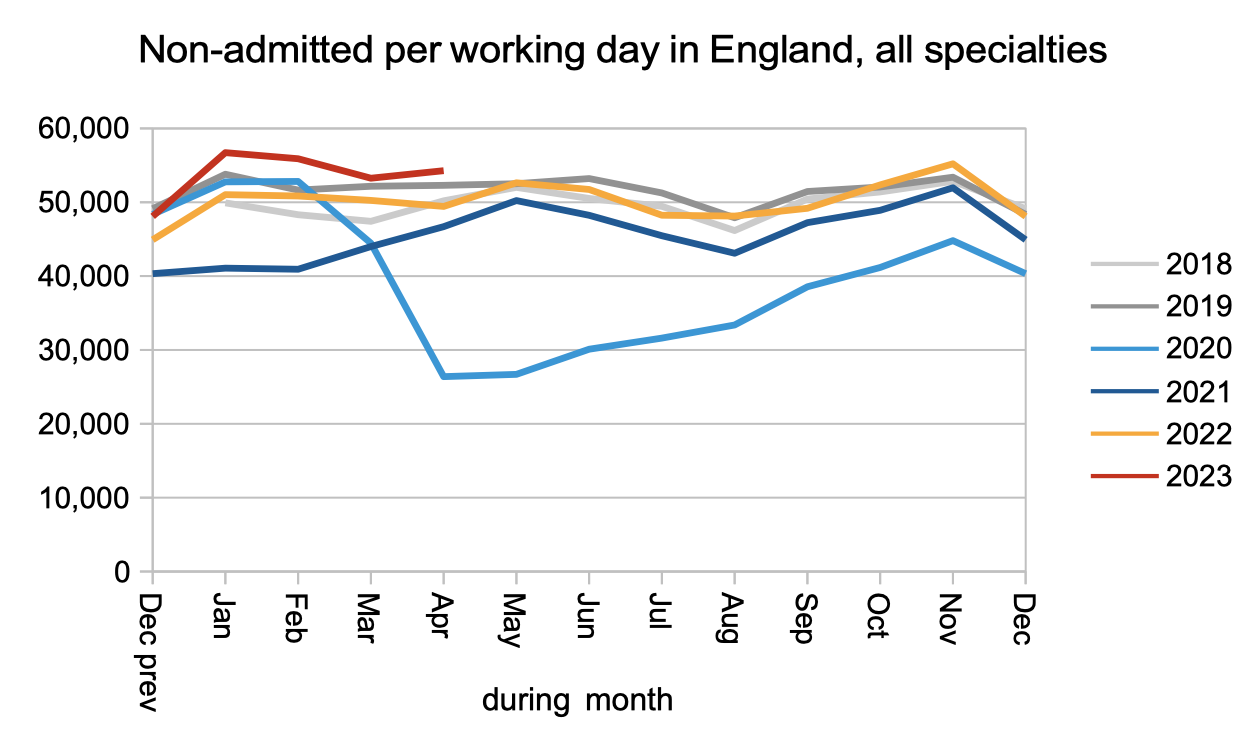
Non-admitted clock stops, which broadly represent those patients who left the waiting list because they were discharged from clinic or removed administratively, remained slightly above pre-pandemic levels.
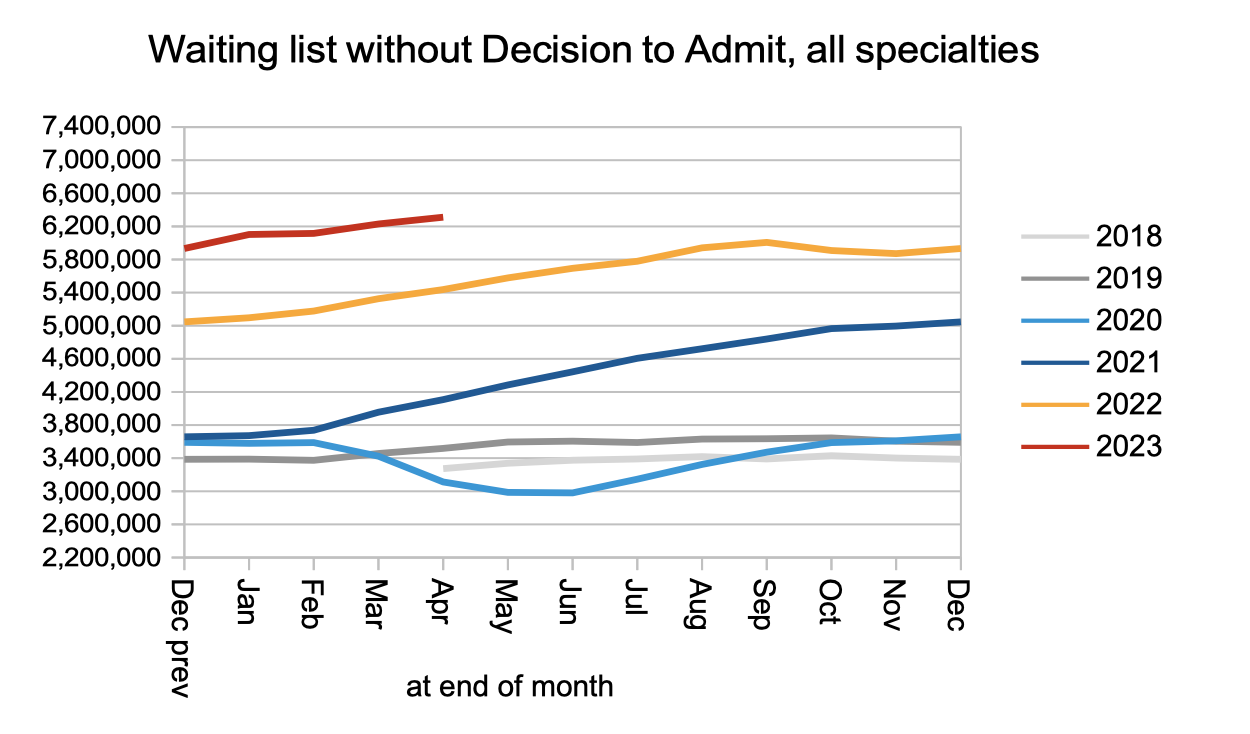
The lion’s share of the RTT waiting list is at the outpatients and diagnostics stages of the pathway: 6.3 million out of the total 7.4 million. The net result of pre-pandemic demand, and only slightly above pre-pandemic non-admitted activity, was that this part of the waiting list grew, and (as we will see below) waiting times from referral to diagnosis and decision grew accordingly. It is this part of the waiting list that I estimate includes 26,845 patients who have unsuspected cancer.
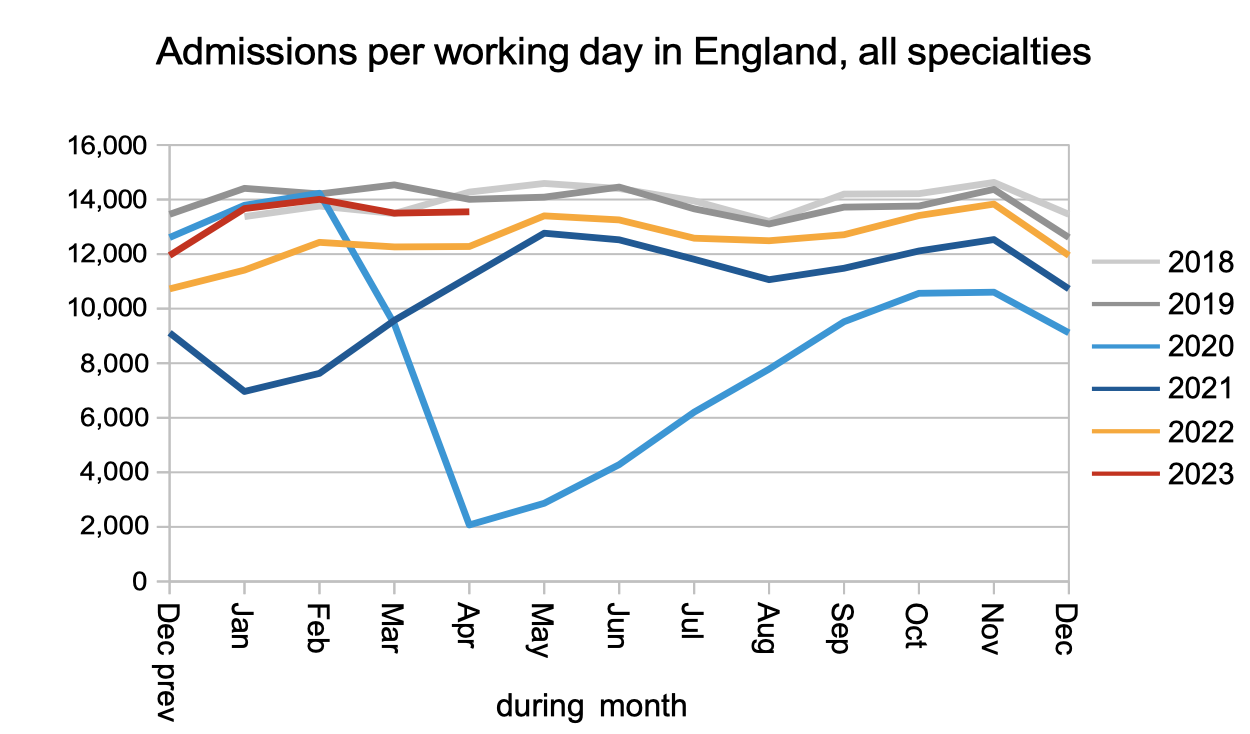
Looking now at patients who do have a decision to admit, we find they continued to be admitted for treatment at lower than pre-pandemic rates.
The overall effect on the total RTT waiting list was that it grew to a new record 7.4 million patient pathways. The red triangle below shows that the list would need to roughly halve before 18 weeks would be achievable again.
With the waiting list growing, waiting times continued to creep up as well. This is in breach of the legislation which still requires 92 per cent of the waiting list to be within 18 weeks.
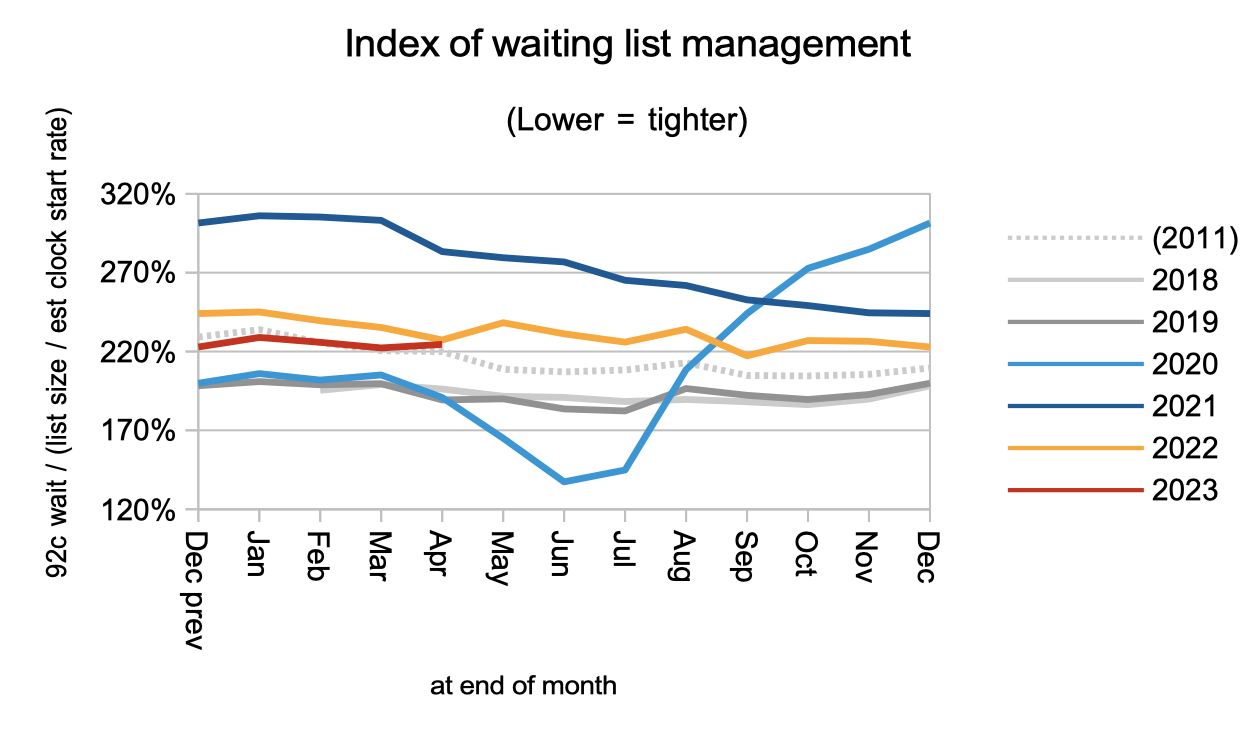
The shape of the waiting list, which is indicated by the index below, remains relatively poor. This is largely caused by the wide variation in waiting times across the country.
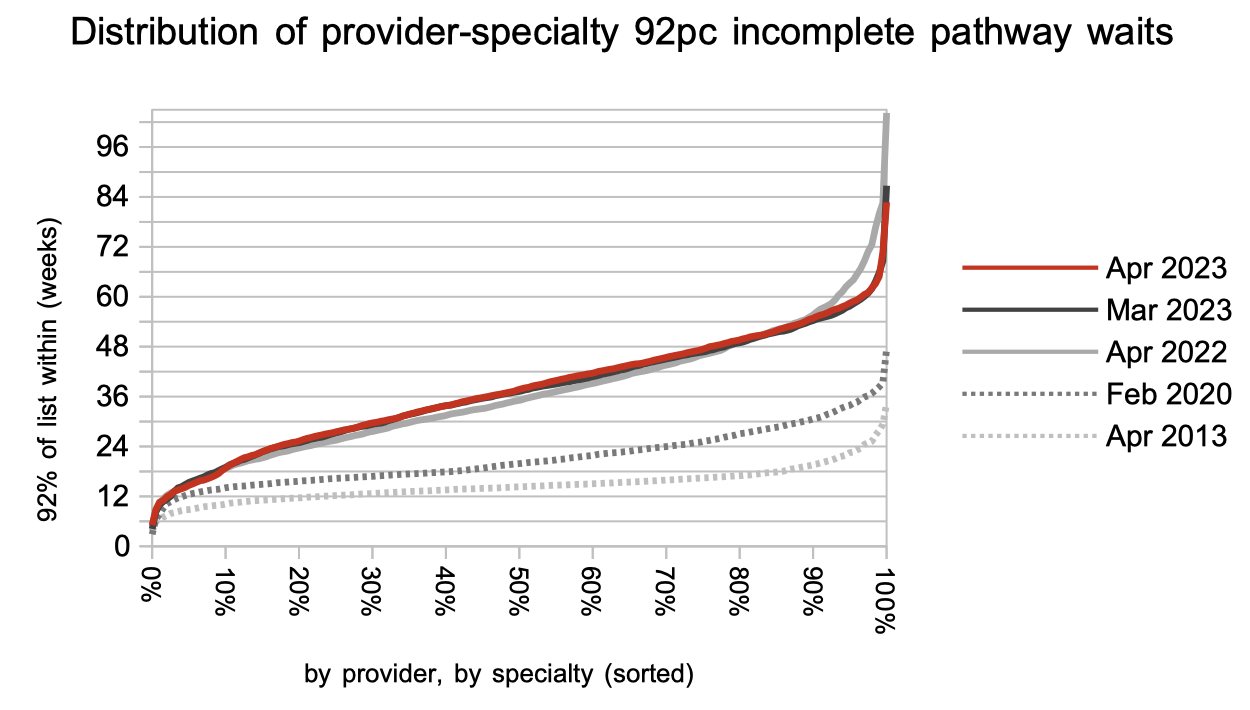
While the very longest waits come down in response to the RTT targets, shorter waiting specialties have been steadily deteriorating as waiting times converge. This shows how the underlying pressures on waiting times are still building in many areas, and progress towards eliminating 104 and 78 week waits does not imply progress towards the targets to eliminate 65 and 52 week waits.
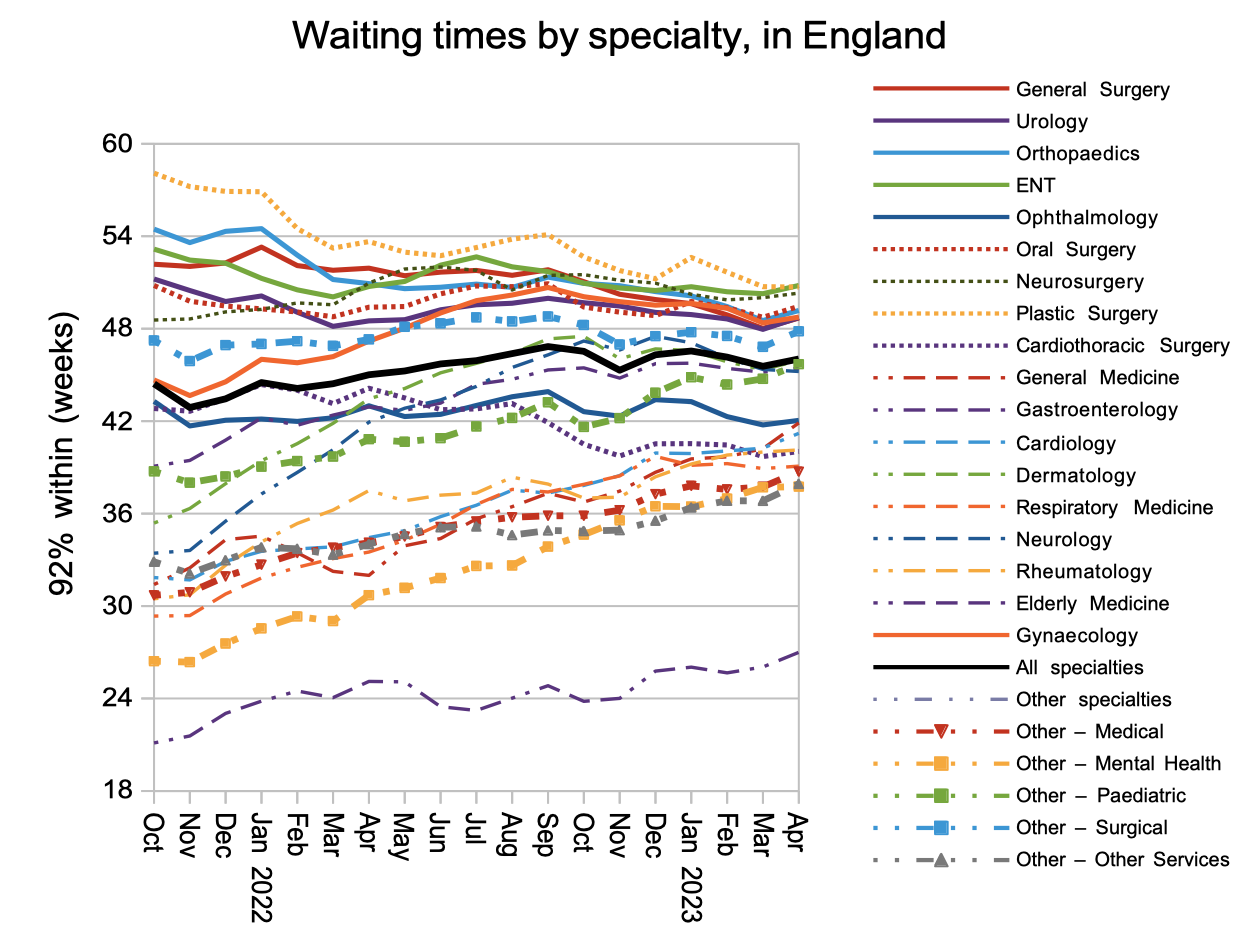
As my separate analysis of the targets to eliminate ultra long waits shows, those specialties where 92 per cent of the list extends beyond 42 weeks will tend to struggle to eliminate all waits above 65 weeks. The chart below shows the distribution of waiting times for over two thousand local specialties at trusts across England, and there are a lot above 42 weeks.
Referral-to-treatment data up to the end of May is due out at 9:30am on Thursday 13th July.