

Early last year, NHS England published a plan to tackle the post-covid backlog of elective care, which set out some ‘ambitions’ to reduce referral-to-treatment (RTT) waiting times. Two of the deadlines have now passed, and two remain.
Analysis produced for Health Service Journal by Dr Rob Findlay, Director of Strategic Solutions at Insource Ltd and founder of Gooroo Ltd
The first deadline was to eliminate two year (104 week) RTT waits by the end of July 2022. They were ‘virtually eliminated‘, meaning that the target was narrowly missed. (It still has not been fully achieved.)
The second deadline was to eliminate 18 month (78 week) RTT waits by March 2023. NHS England claimed ‘great strides‘; that target was properly missed by over ten thousand patient pathways.
The next two targets are to eliminate waits over 65 weeks by March 2024, and over a year (52 weeks) by March 2025 which is after the next general election.
Obviously it is more difficult to achieve a short waiting time than a long one. But what is less obvious is that the NHS’s favourite approach to meeting these targets is running out of steam. In this article I will outline why. For those who live and breathe this topic, there is an accompanying full analysis here.
Cohort targeting
The NHS’s favourite way of achieving a waiting time target is to draw up a list of those patients who are set to breach the target by the deadline, and then try to get those patients seen and treated before that happens.
This can be an effective way of achieving a result on the deadline day. But it is sometimes difficult to book the patients in, because the capacity needed is already full. At least, that is how it looks on the surface, but the underlying causes go deeper.
The most common cause is that the waiting list is simply too big to deliver the target waiting time safely, and the sheer numbers are overwhelming the available capacity.
Sometimes the problem is that patients are not being scheduled in the right order, so capacity is being taken up by patients who are not in the target cohort and are coming in out of turn. And sometimes, it is a combination of both.
The cohort targeting approach does not reveal those underlying causes. But with a bit of further analysis we can surface them, and see why the next two targets are going to be so tough.
Safely achievable waiting times and the 78 week target
We are going to group more than two thousand local NHS services into four categories, based on the waiting list size they had at the time; those that:
- Could achieve the next targets safely and probably would;
- Could achieve the targets safely but probably wouldn’t;
- Probably would achieve the targets but using severe and potentially unsafe methods;
- Could not and probably would not achieve the targets.
We start by going back to July 2022, to see how difficult it was then to eliminate 78 week waits by the end of March 2023. The chart below summarises the position.
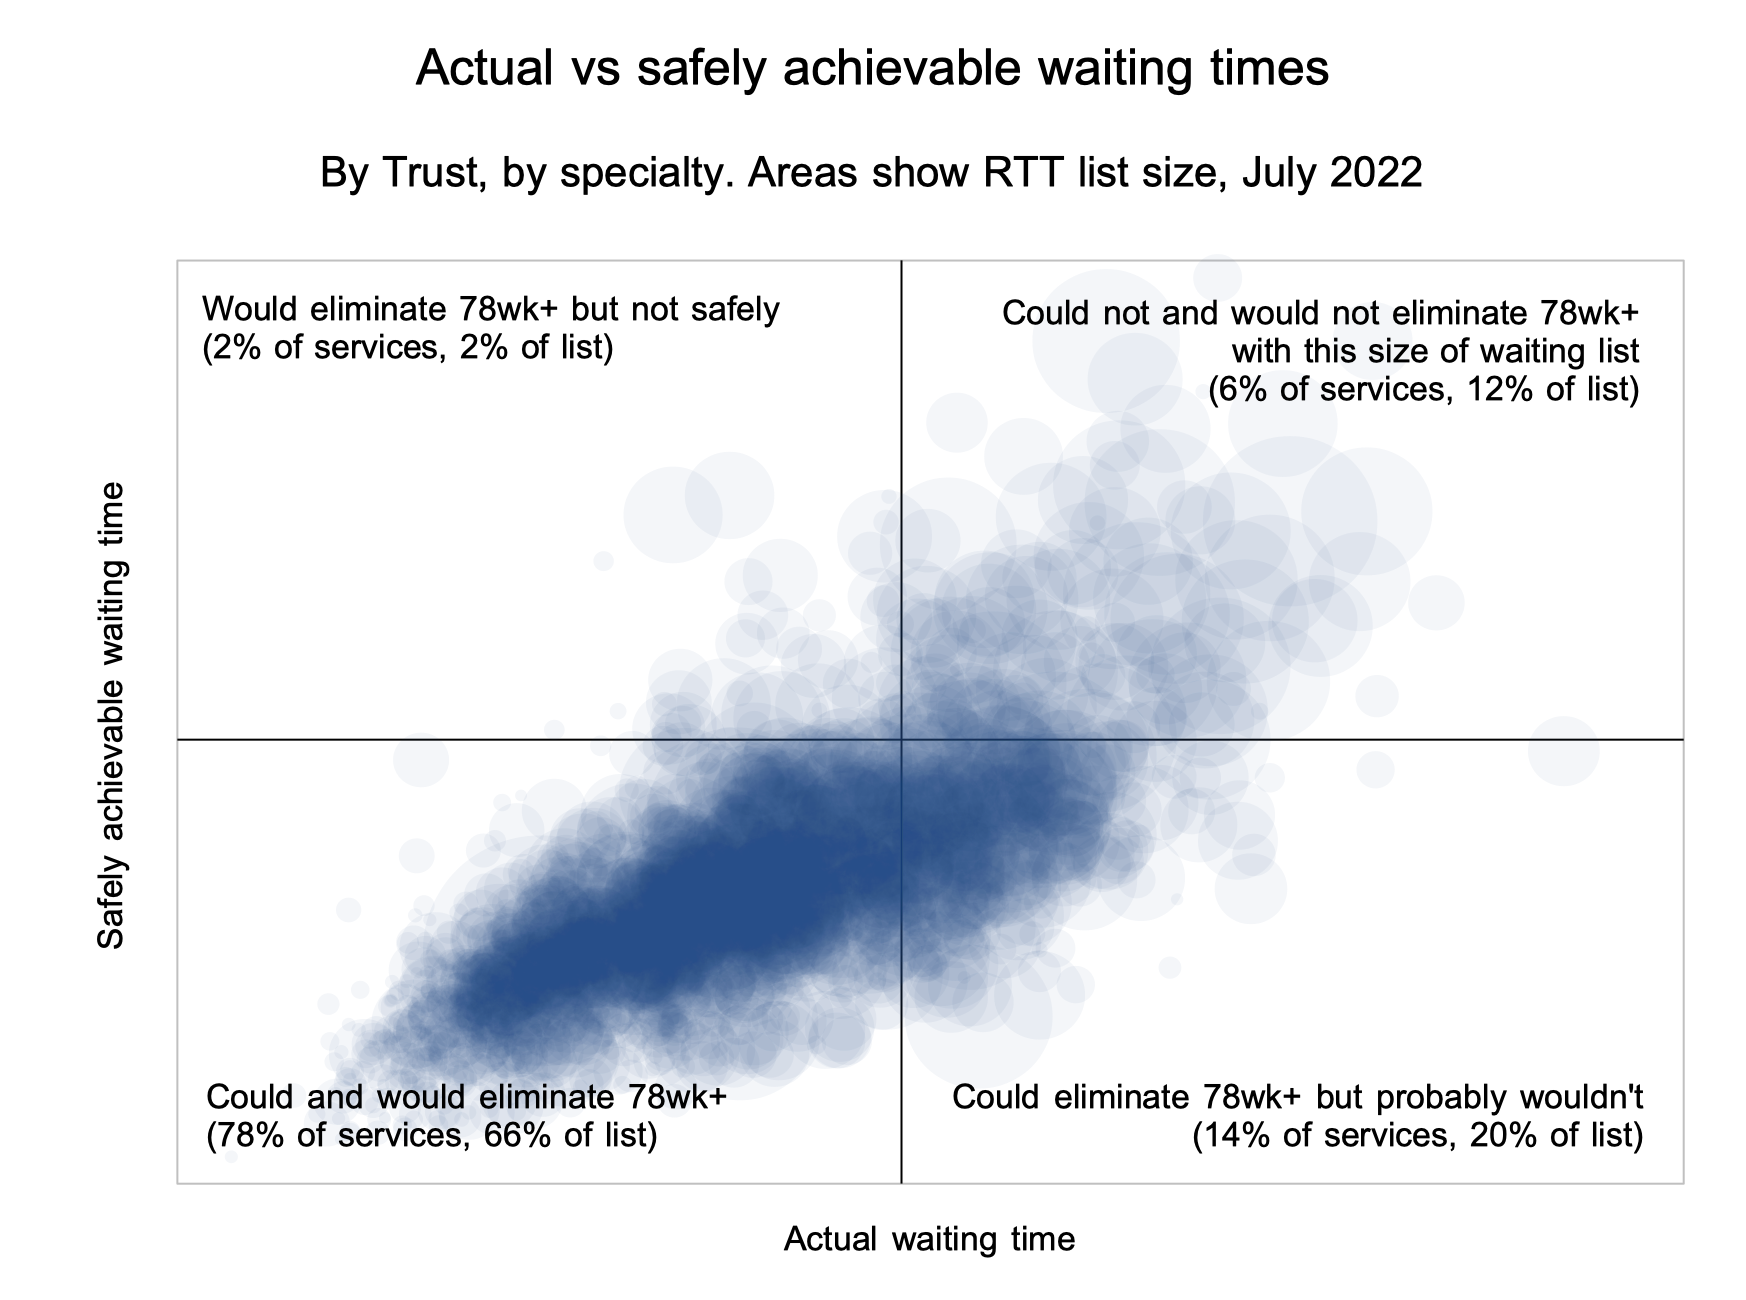
Each circle represents one local service: a specialty within a trust:
- Most local services (78 per cent) are in the bottom left quadrant which means that they would be expected to deliver 78 weeks by March 2023 without needing to reduce their waiting list size.
- The top right quadrant is also easy to understand – these are local services where the waiting list is simply too big to deliver the target.
- The bottom right quadrant is interesting – the list size is small enough to deliver the target, but inconsistent waiting list management means they probably wouldn’t.
- The top left quadrant is the most concerning – the list size is too big to deliver the target safely, but through severe measures they manage to cram inside it anyway.
The RTT data generally is rife with data quality problems so the individual results are not always reliable. But nevertheless I think the overall picture is meaningful, and so is the comparison between the difficulty of the 78 week target above, and the next two targets discussed below. The full analysis includes more detail, with examples of individual services in each of the four quadrants where things turned out as predicted; it also explains how you can get this analysis for your local services.
The next two targets – 65 weeks and 52 weeks
We can repeat this analysis for the next two targets, using the latest data (end of March 2023) as our standpoint.

In the chart above, we can see why the next two targets will be far more difficult, because far fewer services are in the bottom left quadrant:
- Firstly, recall that in July 2022, the analysis suggested that 78 per cent of local services could and would eliminate 78 week waiters without needing to reduce the size of their waiting lists.
- In the chart above, the axes cross at the target to eliminate 65 week waits, and only 58 per cent of services could and would achieve this, based on the waiting list size at the end of March 2023.
- A grey box outlines the target to eliminate 52 week waits, and only 32 per cent of services could and would achieve this.
So for most local services, the cohort targeting approach is rapidly running out of steam. They need other approaches that will sufficiently reduce the size of the waiting list by addressing the balance between activity and demand, and this requires more sophisticated analysis and action – a huge topic in its own right. NHS England are currently talking about getting the basics right – this is what it means and they are right to emphasise it.
The danger is that local services will persist with cohort targeting for too long, simply because it worked in the past, and unaware that it isn’t going to work for them this time. On past form, NHS England are likely to encourage this behaviour, especially as the deadlines draw near. That would expose the NHS to the risk of conspicuous failure against these targets in the run up to the next general election.