

At the end of August, two entire trusts and 5 per cent of local specialties had waiting times longer than 52 weeks.
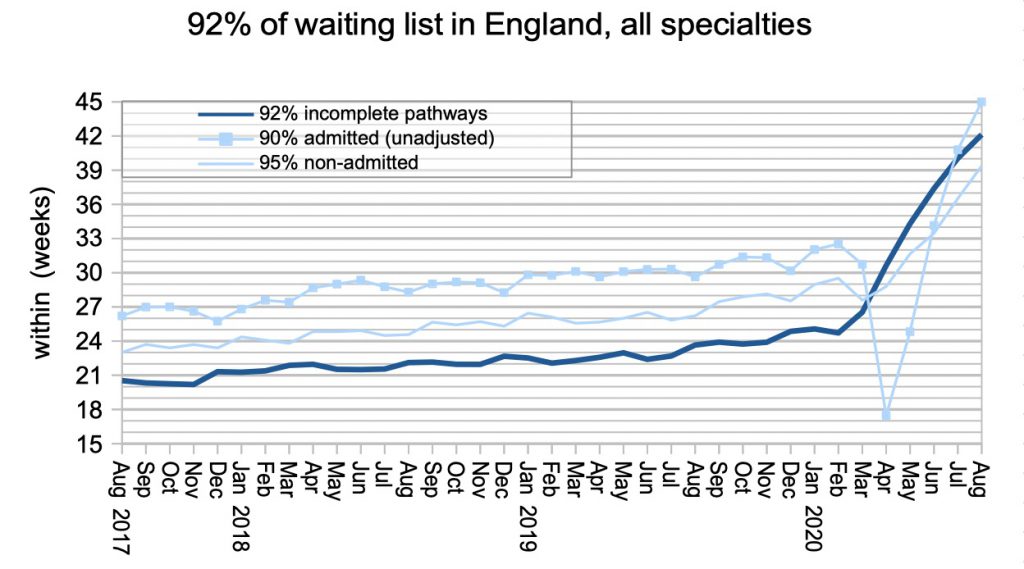
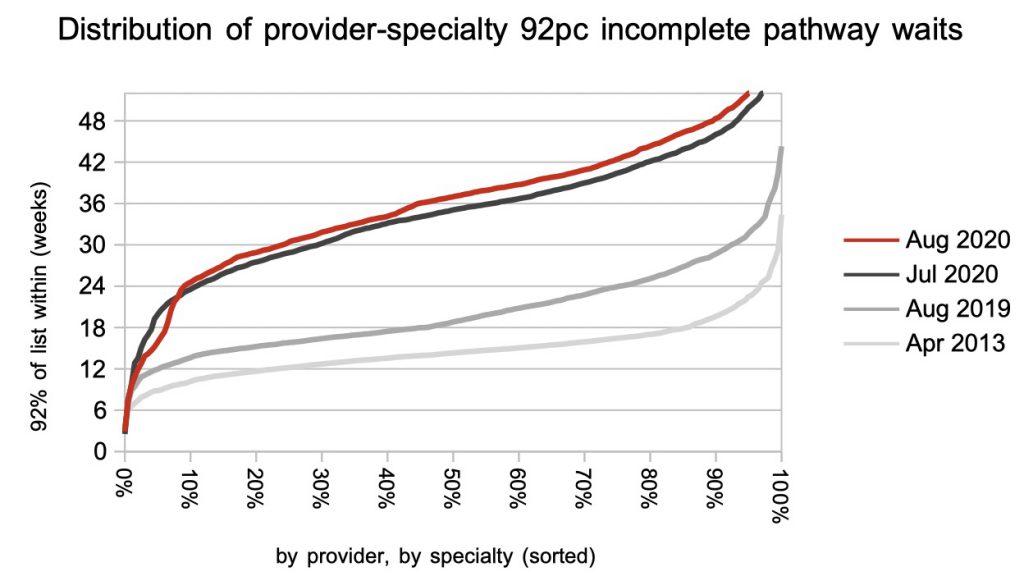
They won’t be the exceptions for long, because waiting times are rising rapidly across England. Before the covid shutdown, 92 per cent of the national waiting list was within 25 weeks. By the end of August that had risen to 42 weeks. We could be facing national waiting times in excess of 52 weeks by the end of March.
But as soon as a waiting time exceeds 52 weeks, the data goes dark. The data collection system never envisaged a catastrophe on this scale. Waiting times are faithfully broken down into weekly cohorts, but the detail ends with a final category of “52 plus”.
This doesn’t matter so much at the moment, because services are only just tipping over 52 weeks so we can be confident that waits are not much longer than that. But as more and more services tip over 52 weeks, and more time passes, the less confident we can be that “52 plus” isn’t hiding some truly awful waiting times.
This matters because of risk. The NHS was unable to keep up with elective demand before covid, and is even more constrained now, so current policy is rightly concerned with minimising risk and slowing the rate of deterioration.
Ultra long waiters are at clinical risk. ‘Routine’ patients on the waiting list, who will eventually be diagnosed with an urgent condition like cancer, are at clinical risk. Patients with undiagnosed cancer who have not yet been referred are at clinical risk.
There are others, but what these patients have in common is that they are hard to see in the data and the problem is getting worse. We need to start revealing them now, to avoid mounting clinical harms in the future.
In the following discussion, all figures come from NHS England and NHS Improvement. If you have a national statistic that you’d like to check up on, you can download our waiting times fact checker.
For analysis of waiting times performance at a particular organisation, visit our reports page. You can also access maps of the latest waiting times across England for A&E, cancer, and RTT.
England-wide picture
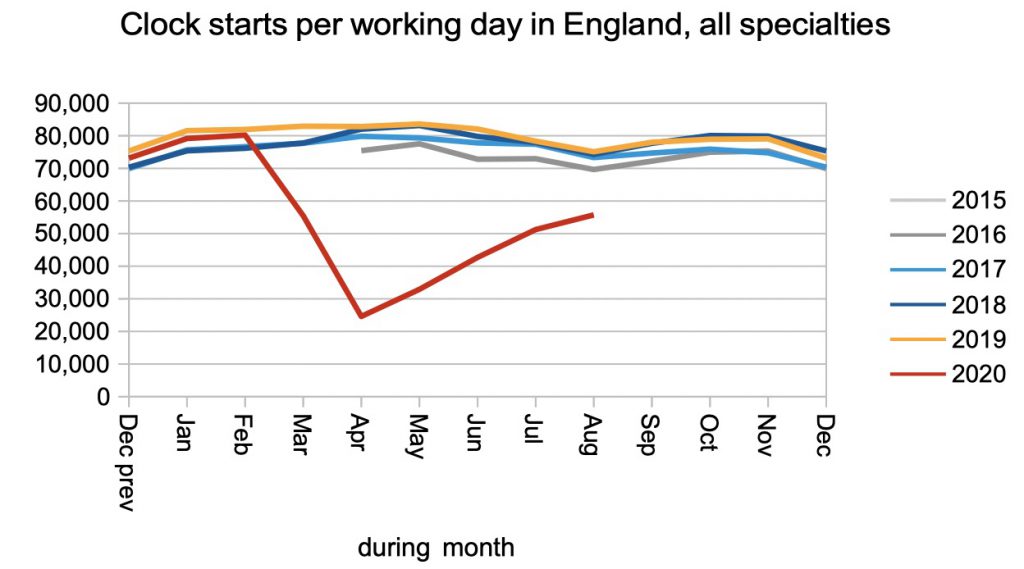
Referrals continued to recover from the covid shutdown, albeit at a slower rate than before (possibly because of the holiday season). It will not be surprising if these referrals eventually rise above the historic rate, as patients who avoided seeing their GPs during shutdown start presenting.
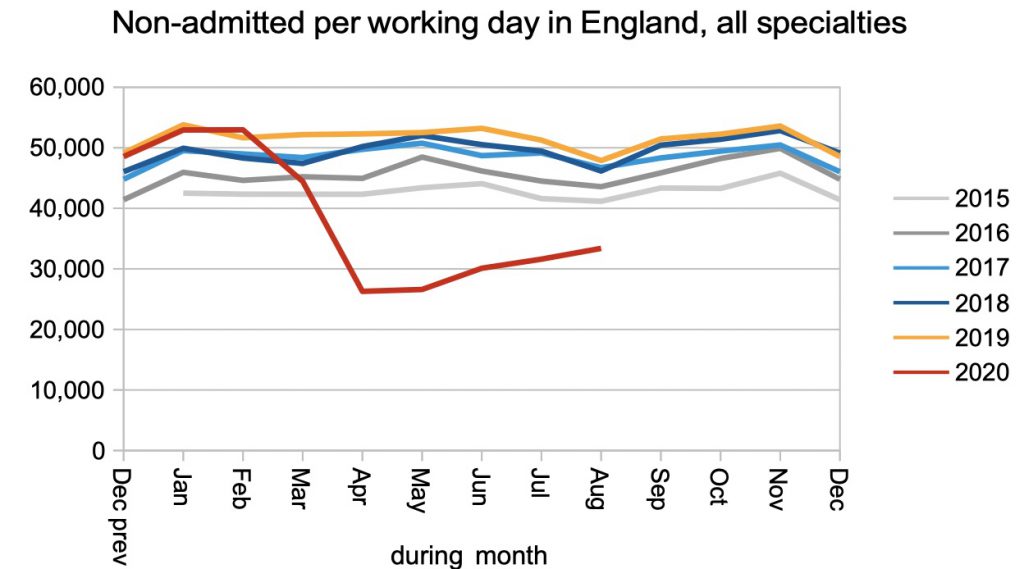
There was a small rise in patients who ended their wait as ‘non-admitted clock stops’ (because they were discharged either from clinic or administratively). But this remains well below the pre-covid rate, which suggests that growing numbers of patients are taking longer to reach diagnosis. Some of them have undetected urgent conditions, but won’t realise until either their condition worsens or they are seen by a specialist.
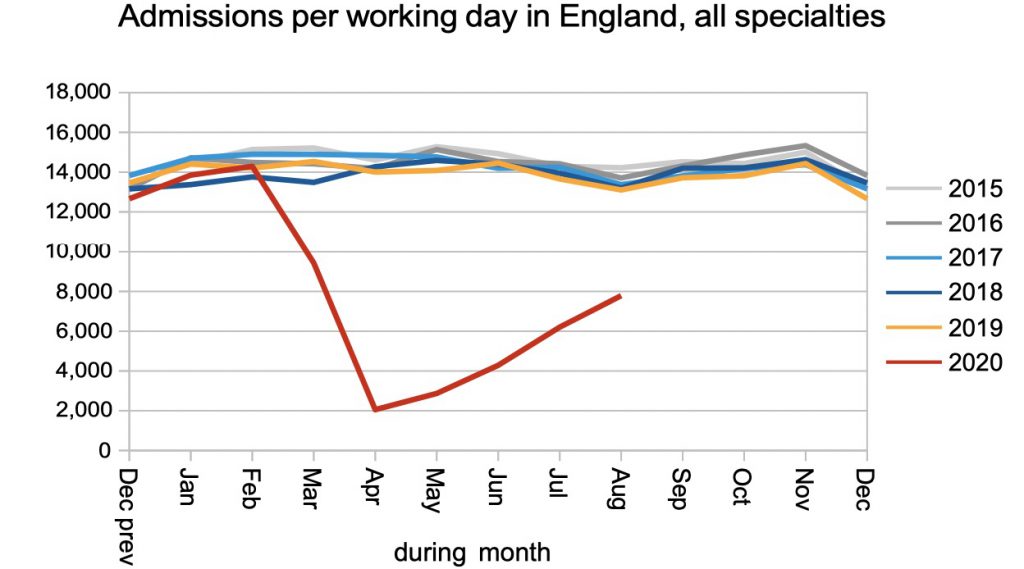
There was a significant rise in inpatient and daycase admissions in August, which is welcome, but it remained well below the pre-covid rate.
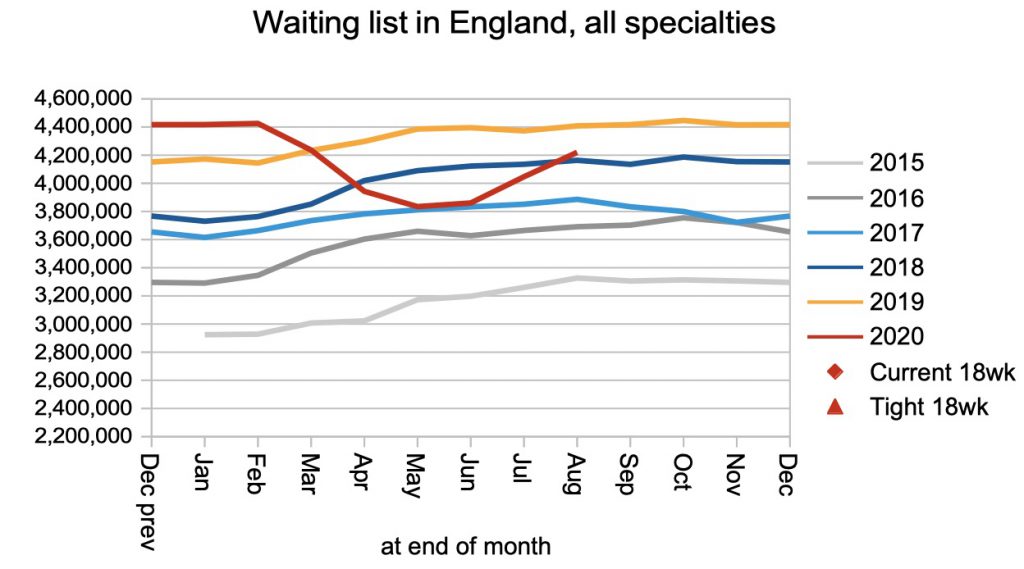
Referrals went up, and treatments and discharges went up. But the referrals went up faster, so the waiting list grew. The waiting list does not include pent-up demand that is still out there in the community, and nobody knows how much it will grow when those patients eventually present to their GPs. Over the coming months we are going to find out.
As the NHS admits more patients for treatment, it is able to treat more of the longest-waiting patients. In August, 10 per cent of admissions had waited longer than 45 weeks. However this attention to treating long-waiters was not enough to stop waiting times from growing, albeit at the slightly slower rate of two weeks during the month.
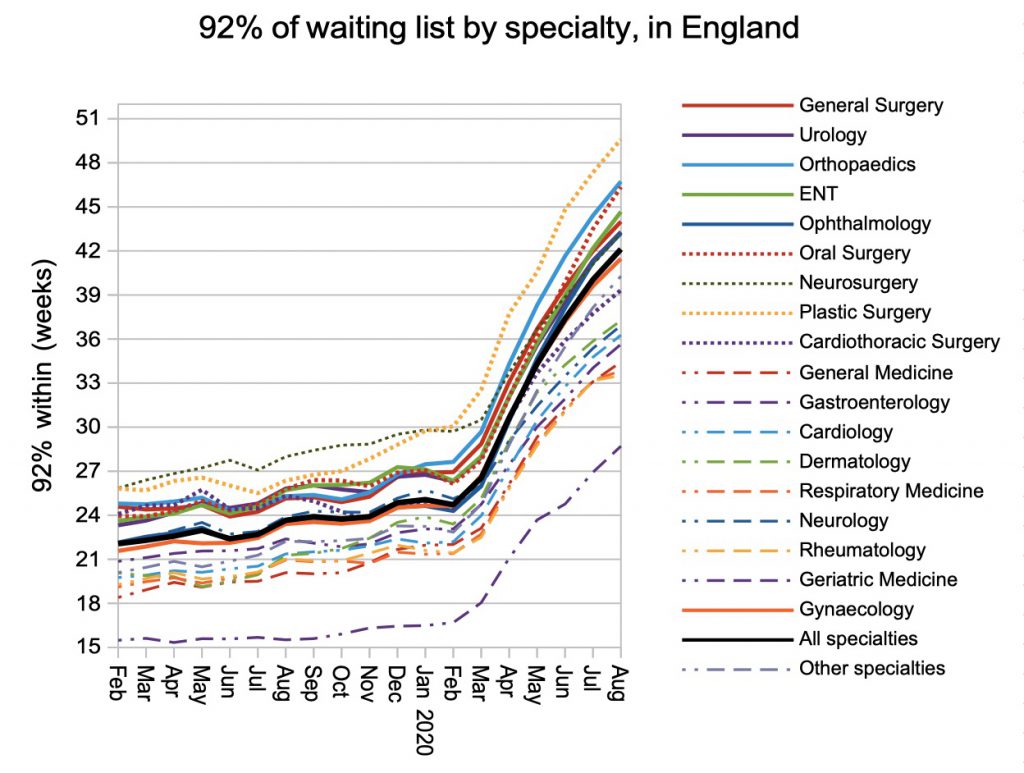
All specialties saw large increases in waiting times. It does look as though waits in medical specialties (shown with dashed lines) are now rising at a somewhat slower rate than in surgery.
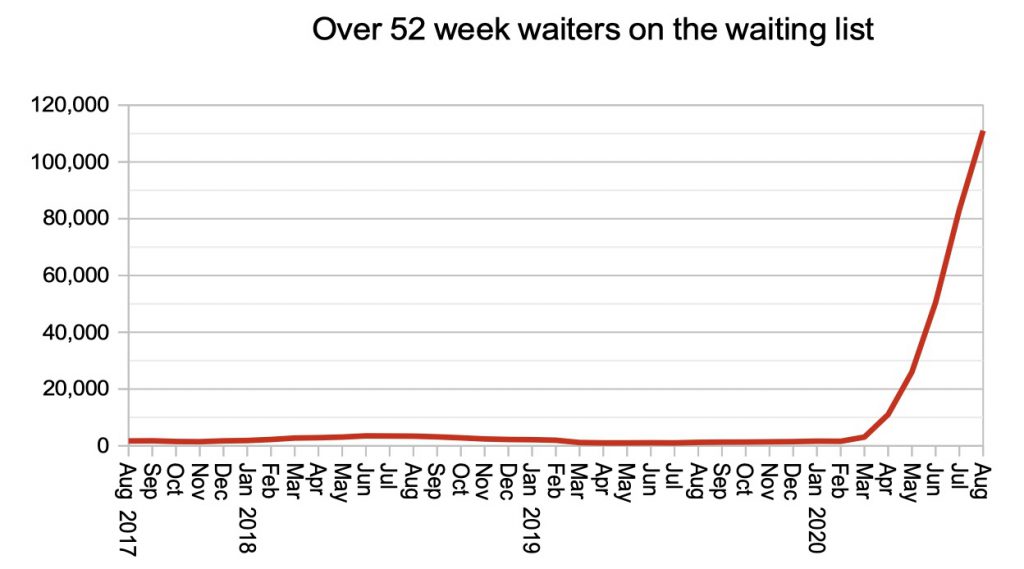
The number of over 52 week waiters continued to rise rapidly.
At this point I would previously have shown you how many local services were achieving the ’92 per cent within 18 weeks’ target, but almost none are so there seems little point in continuing with that.
Instead, here is the proportion of local services (at trust-specialty level) achieving 92 per cent within 52 weeks.
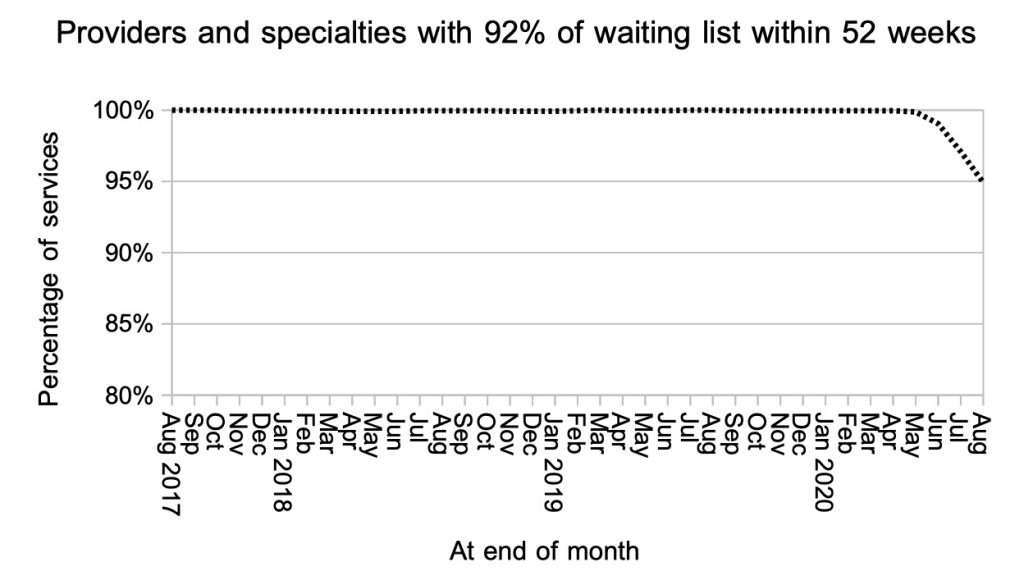
The previous chart tracks where the red line in the chart below crosses 52 weeks. There is a likely relationship between the next chart and the specialty-level chart above, where we saw that surgical specialties have longer and more rapidly-rising waiting times than medical specialties.
Referral-to-treatment data for September 2020, the sixth complete month since the covid-19 elective shutdown, is due out at 9:30am on Thursday 12th November.