

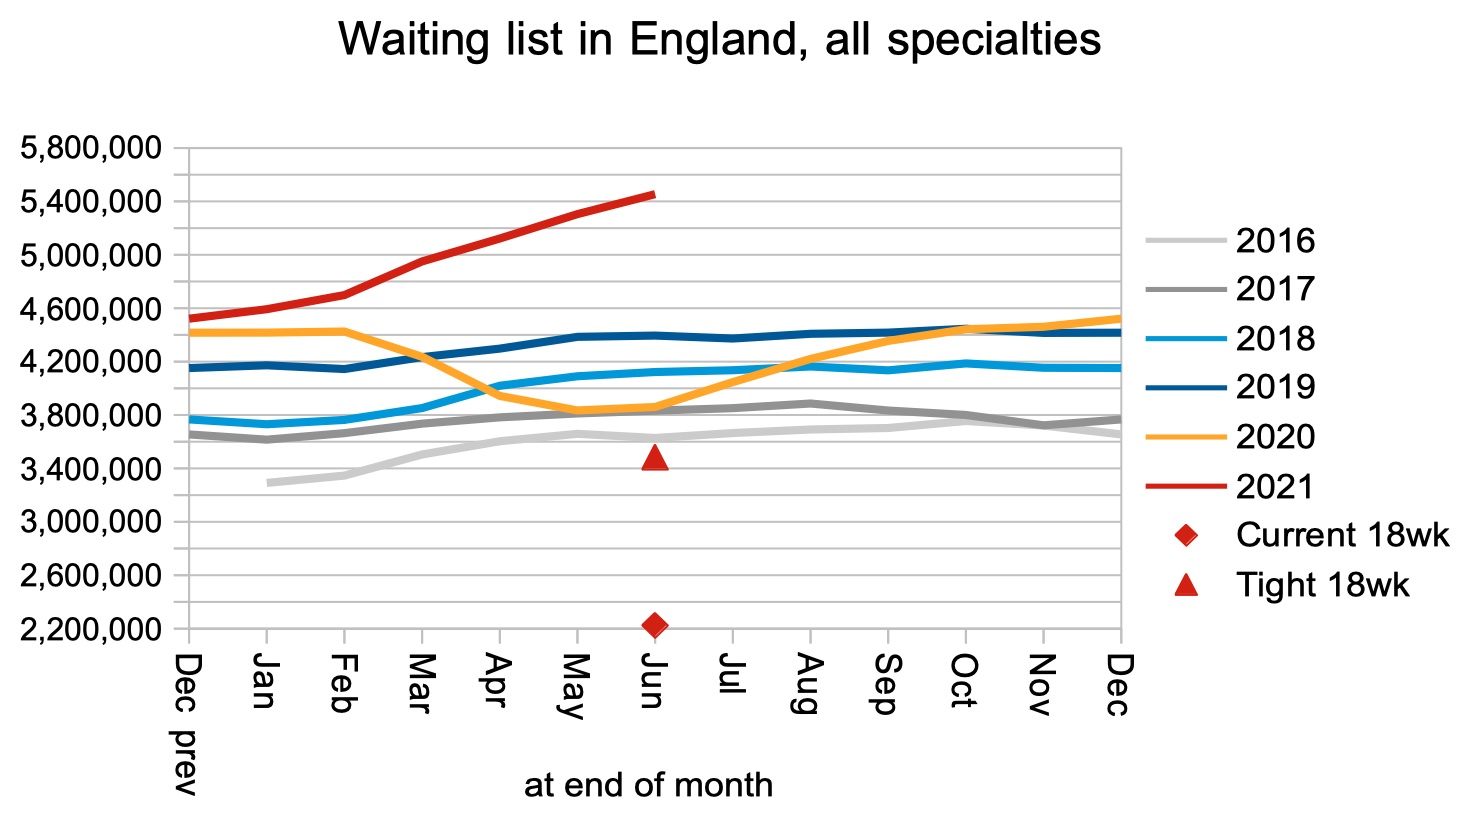
The waiting list continued to grow rapidly in England during June, passing 5.4 million for the first time, as the underlying pressure on waiting times continued to grow.
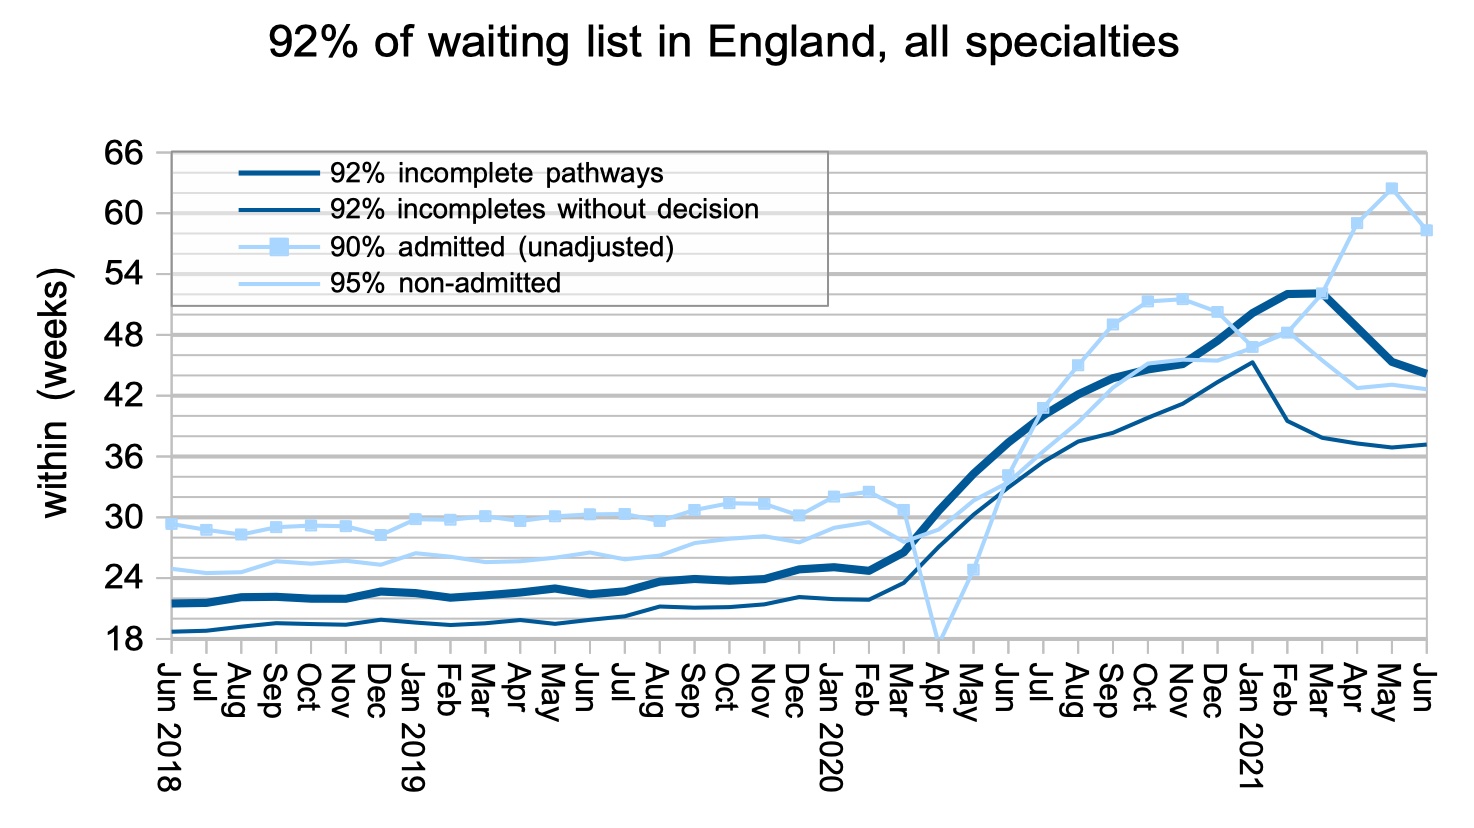
Waiting times from referral up to diagnosis and decision to admit, which had been improving since January 2021, bottomed out and lengthened slightly to 37.2 weeks during June. These very long waits for diagnosis mean that unsuspected cancers and other urgent conditions are not being detected quickly enough, and make it difficult to manage non-urgent conditions effectively while patients wait for routine treatment.
The number of patients waiting longer than 104 weeks (about 2 years) all the way from referral to treatment rose from 3,927 at the end of May, to 5,727 at the end of June (of which 1,229 were in orthopaedics).
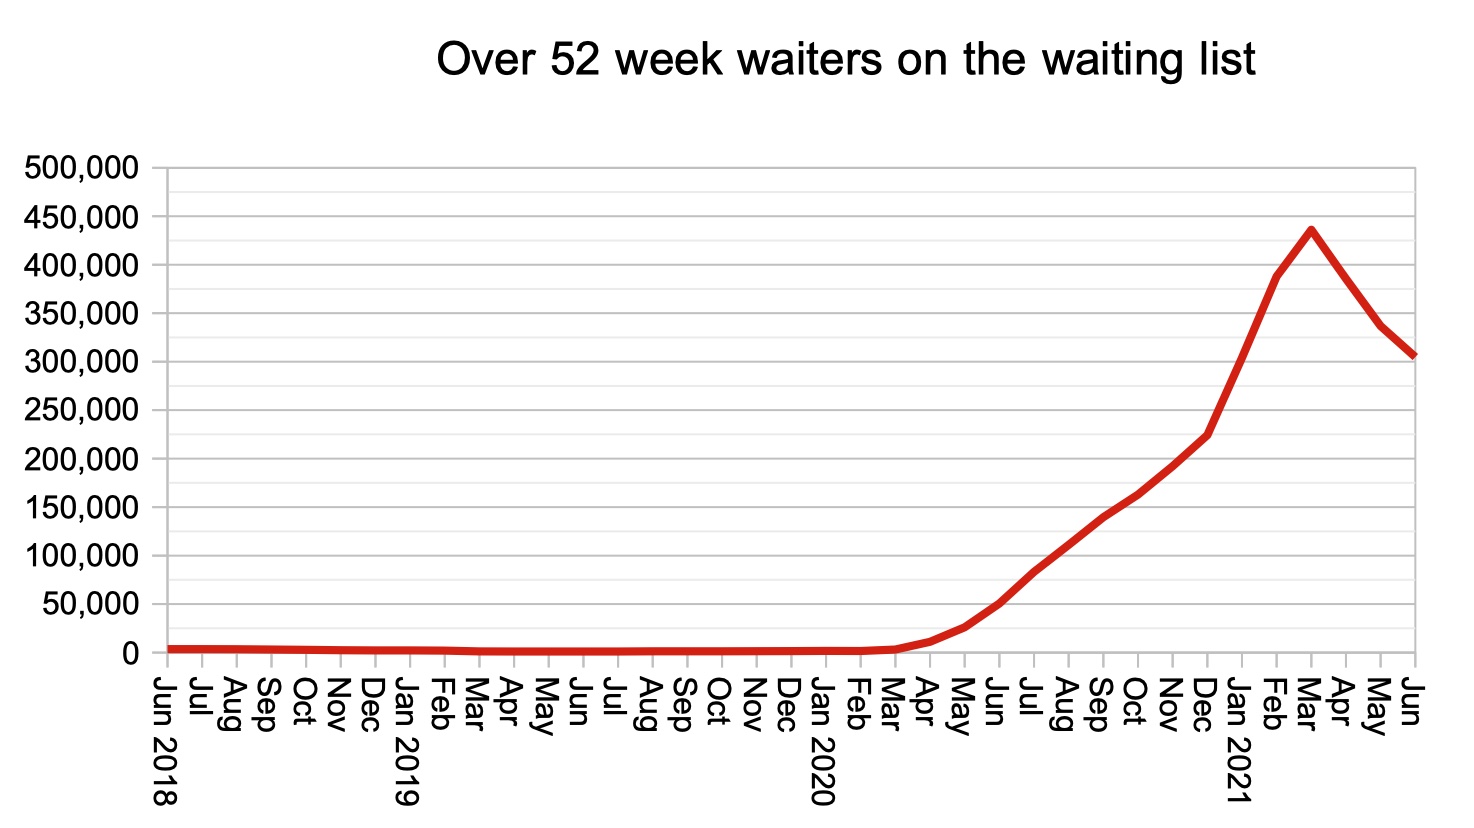
The number of patients waiting 52 weeks and longer fell again from 336,733 to 304,803 patients, which partly reflects the NHS’s efforts to treat the longest-waiting patients, but also partly reflects the fact that 52 weeks previously we were still in the first covid shutdown when few patients were being referred.
In the following discussion, all figures come from NHS England and NHS Improvement. If you have a national statistic that you’d like to check up on, you can download our waiting times fact checker.
For analysis of waiting times performance at a particular organisation, visit our reports page, or our map of the latest RTT waiting times across England.
England-wide picture
The number of ‘clock starts’ (patients being added to the waiting list for consultant led treatment) remained roughly at pre-covid levels. These are the last figures before the general lifting of legal covid restrictions on 19th July, and do not yet show the anticipated surge of pent-up demand returning to the NHS.
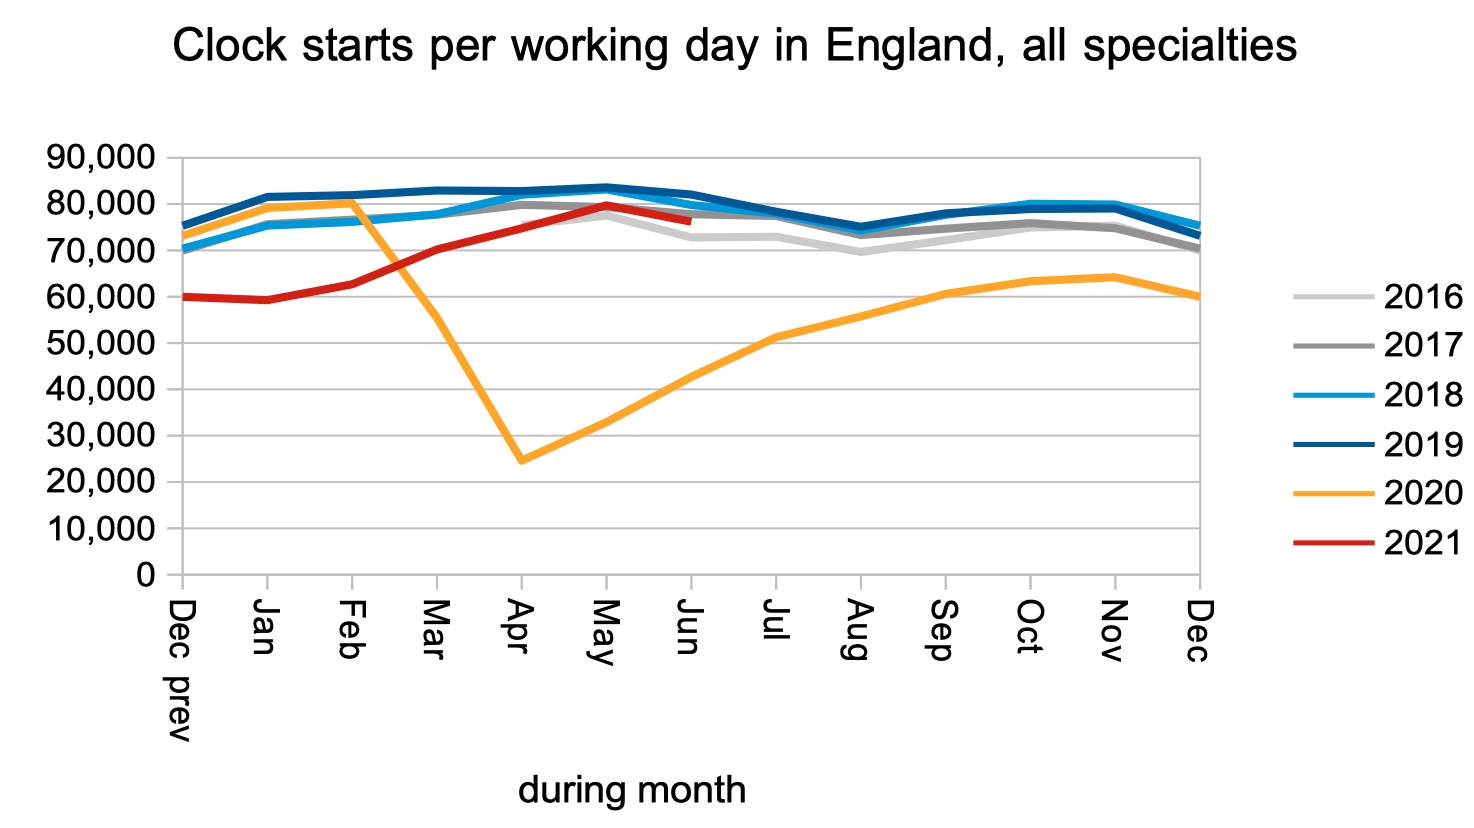
The number of patients being discharged from outpatients also continued roughly at pre-covid levels.

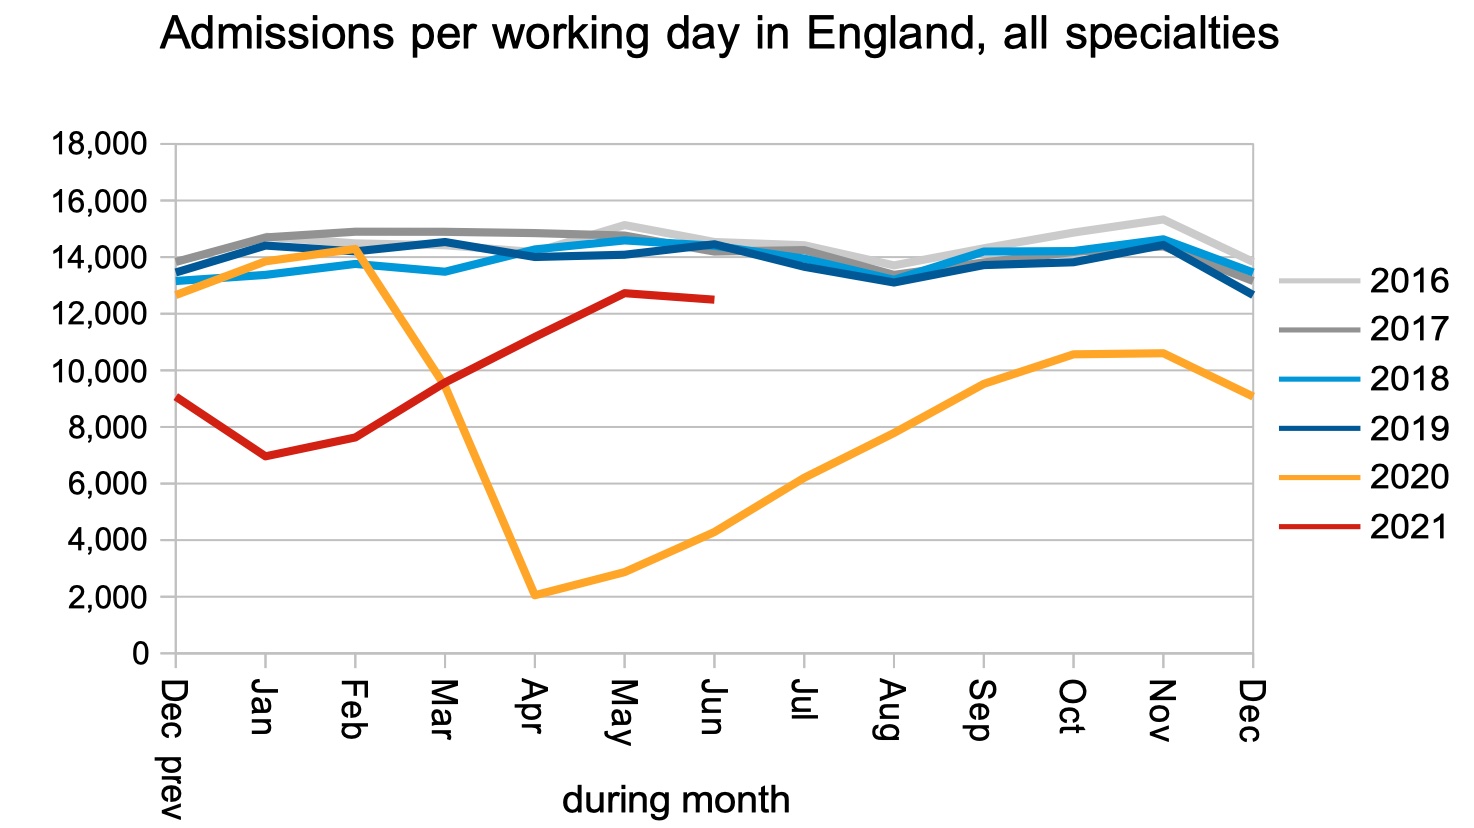
The admission rate remained significantly below pre-covid levels, hampered by ongoing infection prevention and control measures for patients who come in to hospital.
The net result was that the waiting list continued to grow rapidly. This is a good indicator of the underlying pressures on waiting times, which will continue to grow until the NHS is able to keep up with elective demand.
Although the underlying pressure on referral-to-treatment (RTT) waiting times increased, the observed RTT waiting times fell. This is partly because the NHS is managing to treat more long-waiting patients, but also because fewer patients were being added to the waiting list in the summer of 2020, and this lull has now passed through to the longer-waiting end of the waiting list.
The long waiting time from referral, up to diagnosis and decision to admit, is of greater concern. These waits had been improving since January, but that improvement has bottomed out and waits to diagnosis have started to lengthen again. In June the wait from referral to decision lengthened from 36.9 to 37.2 weeks.
The number of one year waiters fell again, but (as noted above) this is the anniversary of the first covid shutdown when few patients were being referred, which means there are fewer patients ‘tipping over’ the 52 week mark.
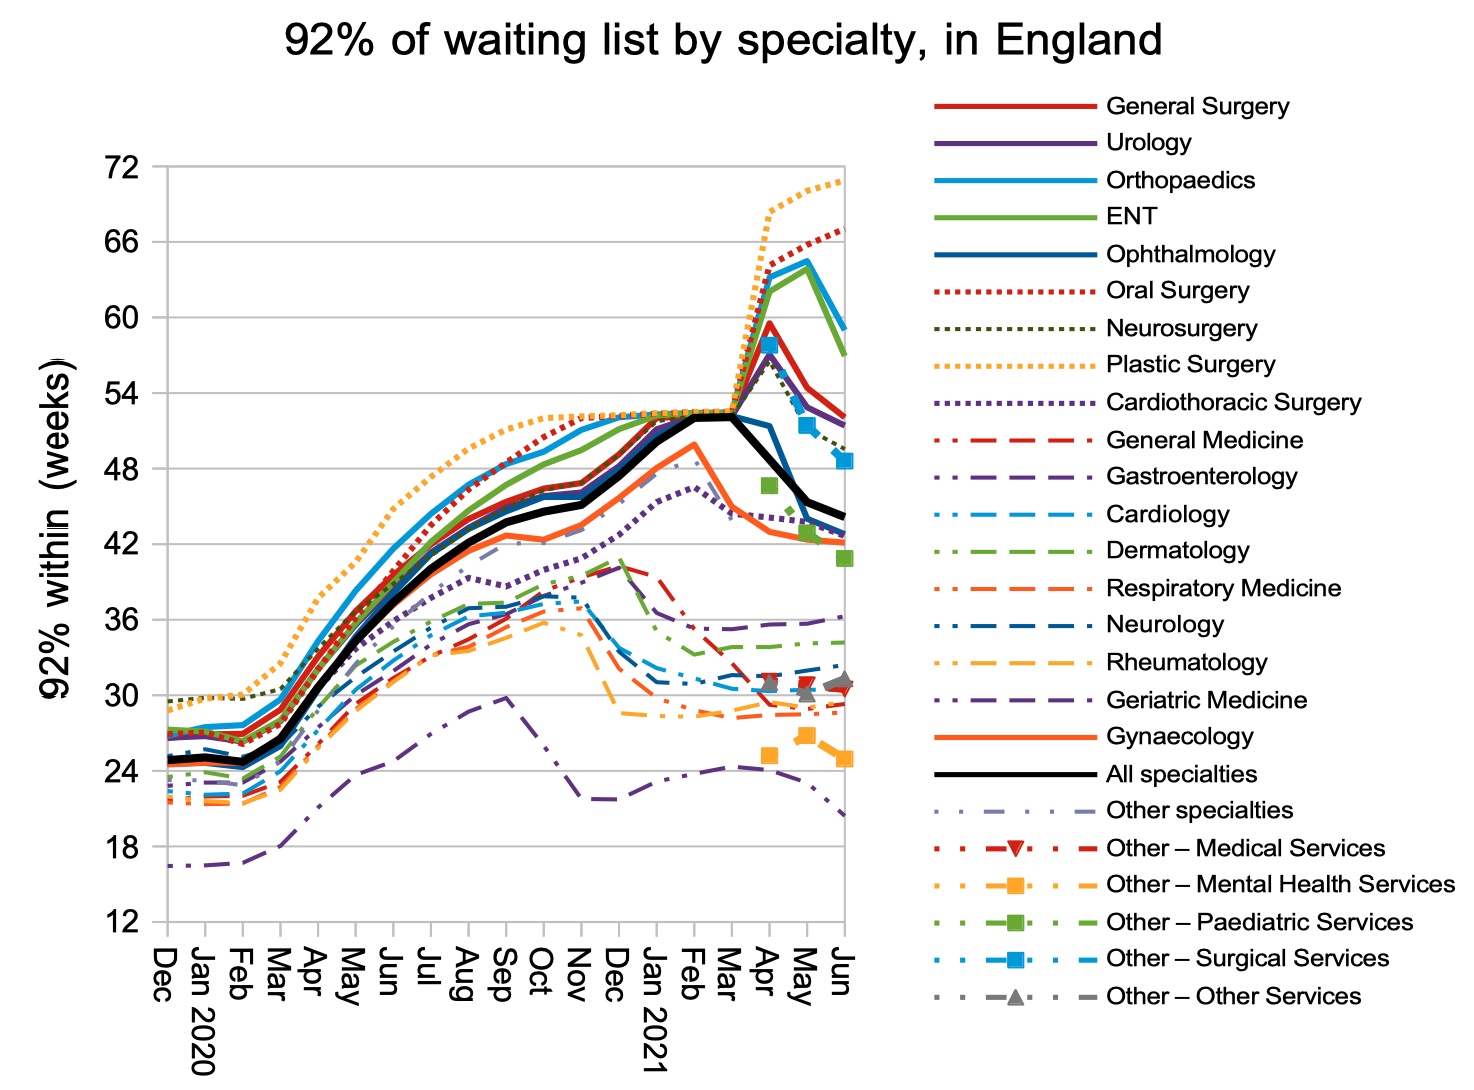
Waiting times are long and growing in Plastic Surgery and Oral Surgery, while generally improving elsewhere.
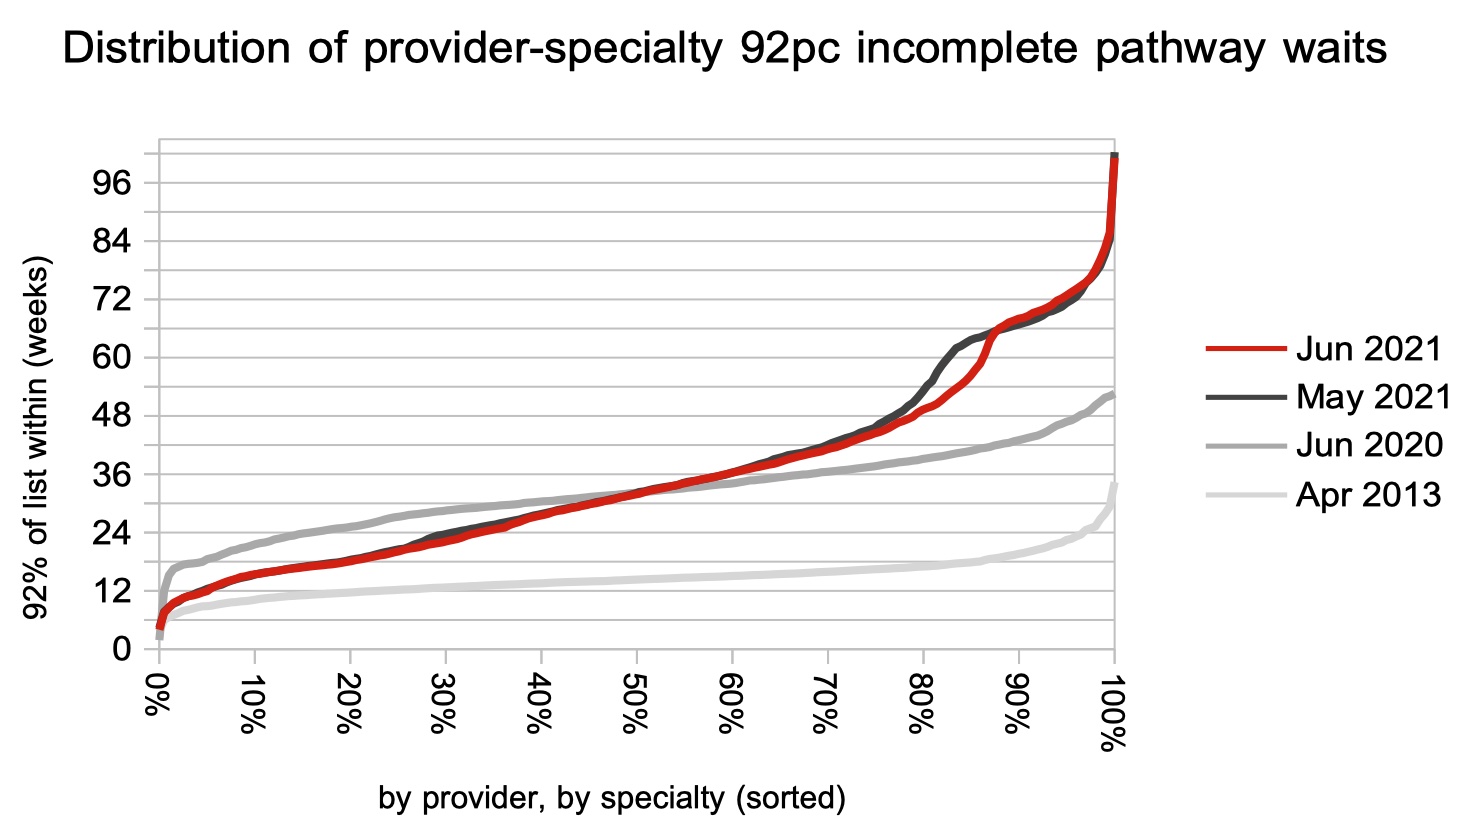
The distribution of local waiting times showed little change up to the end of June, aside from the moving kink which marks the beginning of the first covid shutdown, 66 weeks earlier.
Referral-to-treatment data up to the end of July, which will be the first following the easing of general covid restrictions, is due out at 9:30am on Thursday 9th September.