

While the centre tries to make it look as though waiting times are coming down, the overall reality is that the waiting list and waiting times are getting worse. Allowing for non-reporting trusts, the overall waiting list grew in September from 7,070,199 patient pathways to 7,138,772, while reported waiting times grew from 46.4 to 46.8 weeks.
Analysis produced for Health Service Journal by Dr Rob Findlay, Director of Strategic Solutions at Insource Ltd and founder of Gooroo Ltd
At the end of September some 2,239 patients were reported waiting longer than 104 weeks for treatment in England, according to the latest referral-to-treatment (RTT) waiting times data. This may be the last trustworthy figure we ever see because, from October, the Department of Health and Social Care together with NHS England are asking the NHS to adjust some patients’ waiting times downwards when reporting them (which may be unlawful), while still managing them in real life at their original position on the waiting list.
Even more worryingly, over 6 million patient pathways were still waiting for their diagnosis and decision, of whom an estimated 25,542 were unaware that their eventual diagnosis would be cancer. The waiting time for that diagnosis and decision grew from 43.3 to 44.0 weeks, which is far too long for any undiagnosed urgent condition.
In the following discussion, all figures come from NHS England. If you have a national statistic that you’d like to check up on, you can download our waiting times fact checker. For analysis of waiting times performance at a particular organisation, visit our reports page, or our map of the latest elective waiting times across England.
The numbers
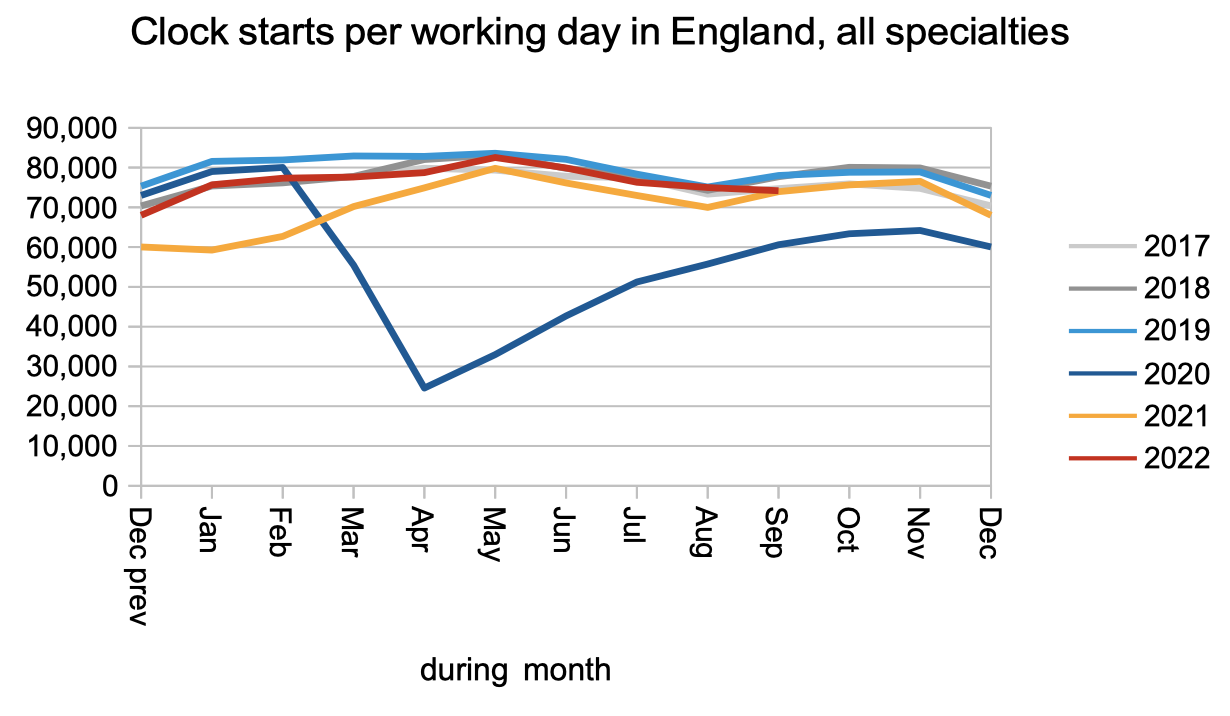
The overall pattern of demand and activity was similar to recent months. Demand (in the form of patients starting new waiting time ‘clocks’) was close to pre-pandemic levels.
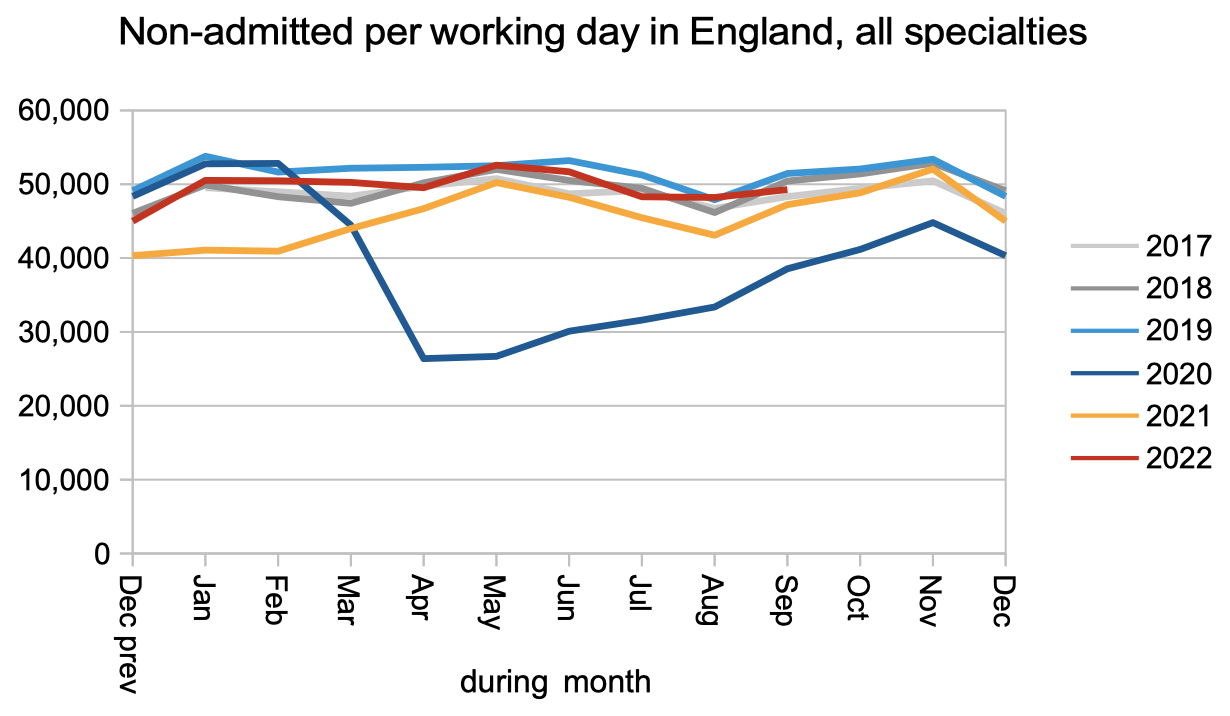
Non-admitted clock stops, mainly patients discharged from clinic or removed administratively, were also close to pre-pandemic levels.
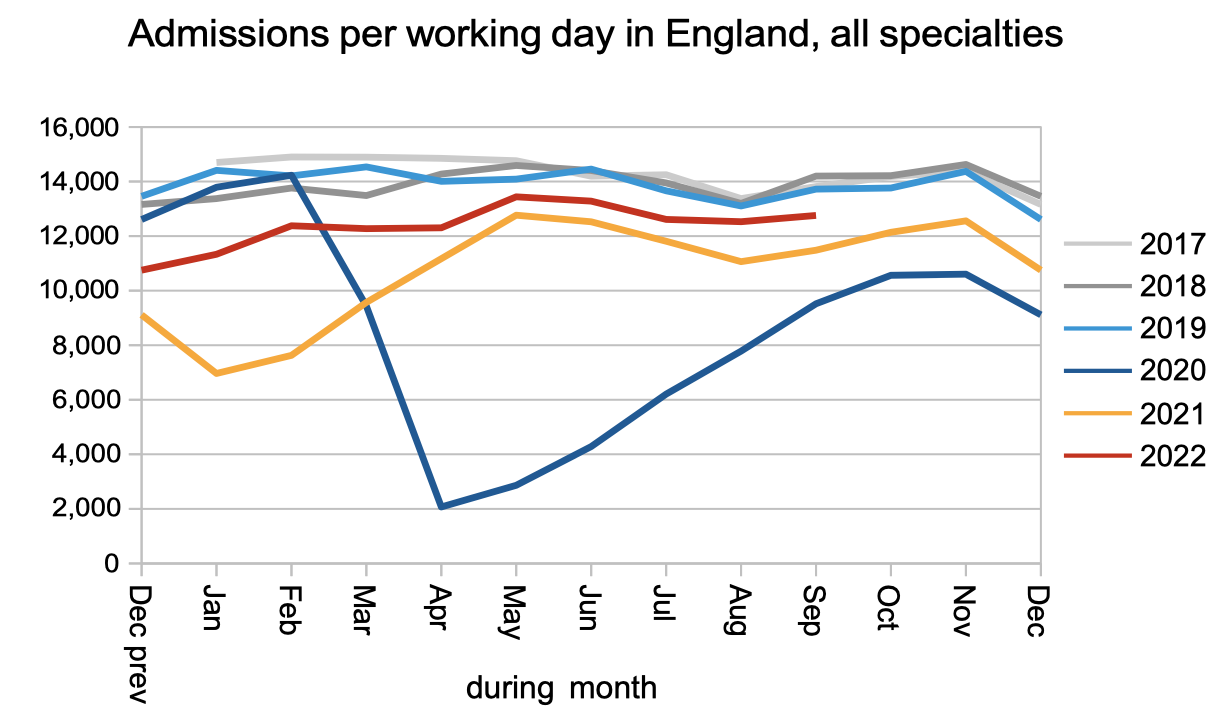
Admissions for inpatient and daycase treatment were below pre-pandemic levels.
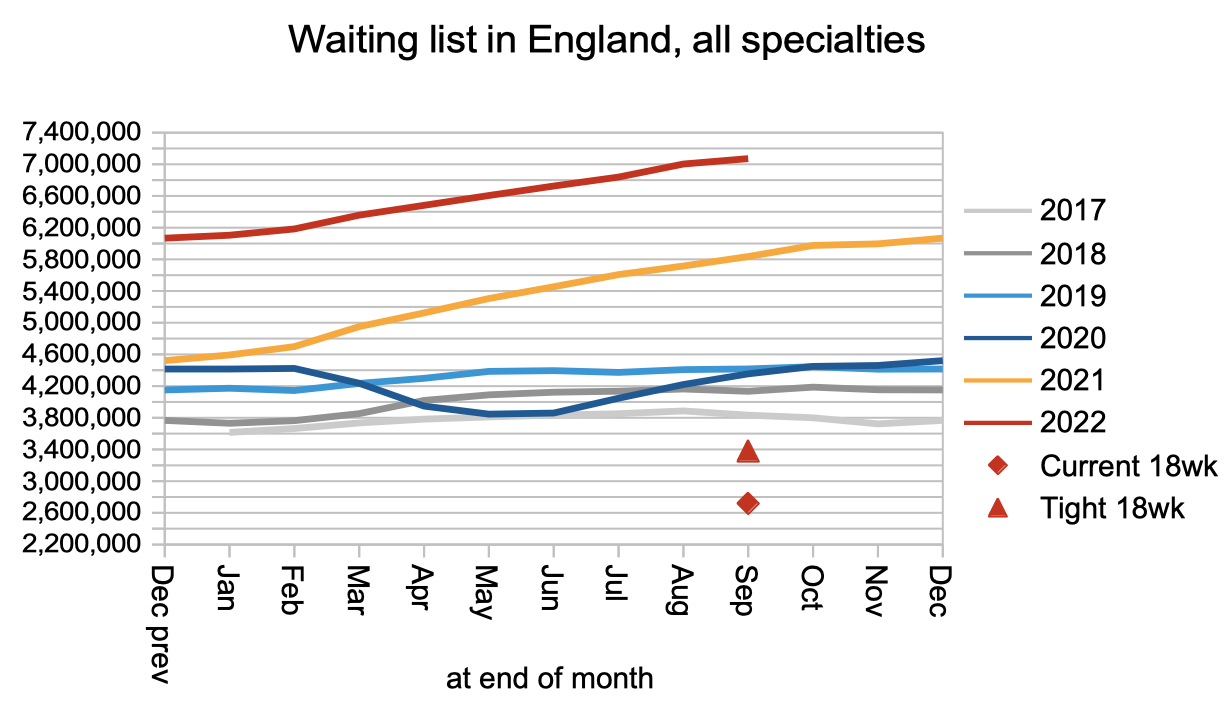
The net result of activity falling short of demand is a growing waiting list. Overall waiting lists and waiting times will continue to deteriorate until the NHS is able to keep up with demand.
I don’t usually focus on the raw numbers of patients waiting longer than arbitrary thresholds, even though it is a favourite metric of NHS England’s, for two main reasons. Firstly, what matters to patients is how long they are going to wait, not how many others are in the same boat. Secondly, because it is not usually a good guide to what is happening overall.
I do make an exception for data on extreme long waits, because of the risk and fear that extreme waits create for patients. The other exception is when typical routine waiting times happen to be close to the selected threshold, when the numbers are reflective of what is happening (although still inferior to measuring the actual waiting time), and this is my excuse on this occasion.
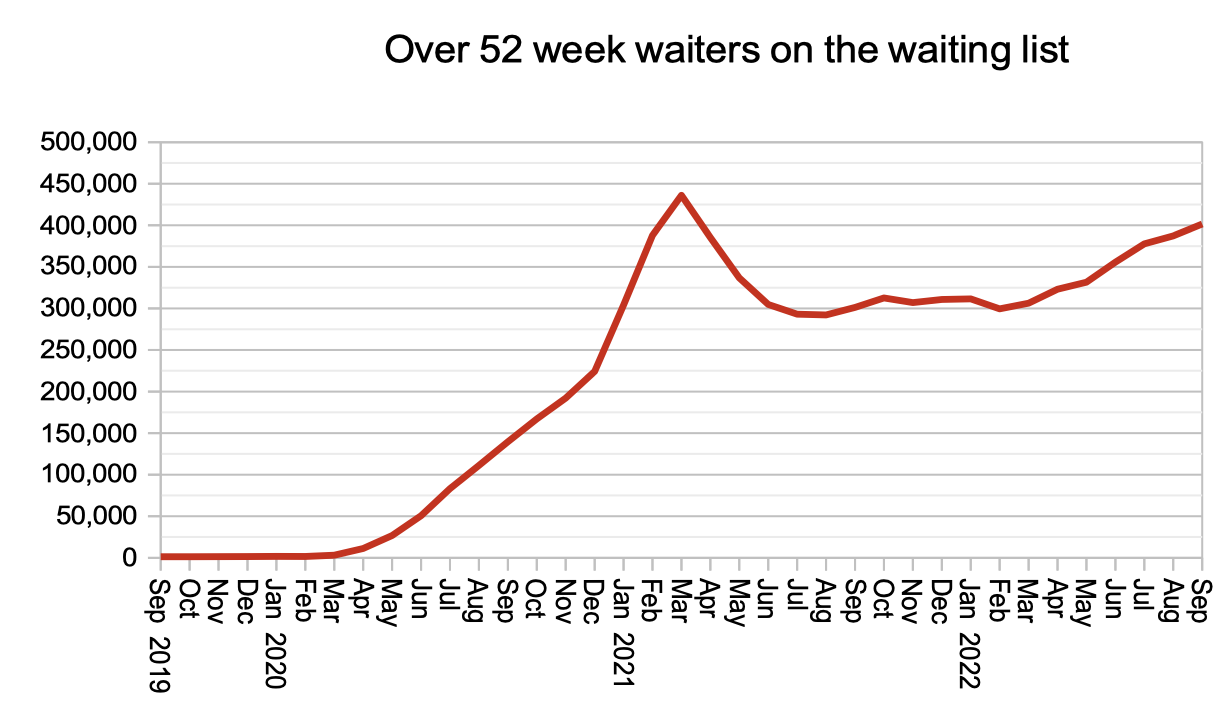
As waiting times approach 52 weeks once more, the number of over-one-year waiters is rising rapidly and has passed the 400,000 level again. Apart from the darkest days of the pandemic, this is the largest number of one year waiters since the advent of RTT waiting times in 2007. The ill-advised target is “That the waits of longer than a year for elective care are eliminated by March 2025” so the current trend shows that things are heading rapidly in the wrong direction.
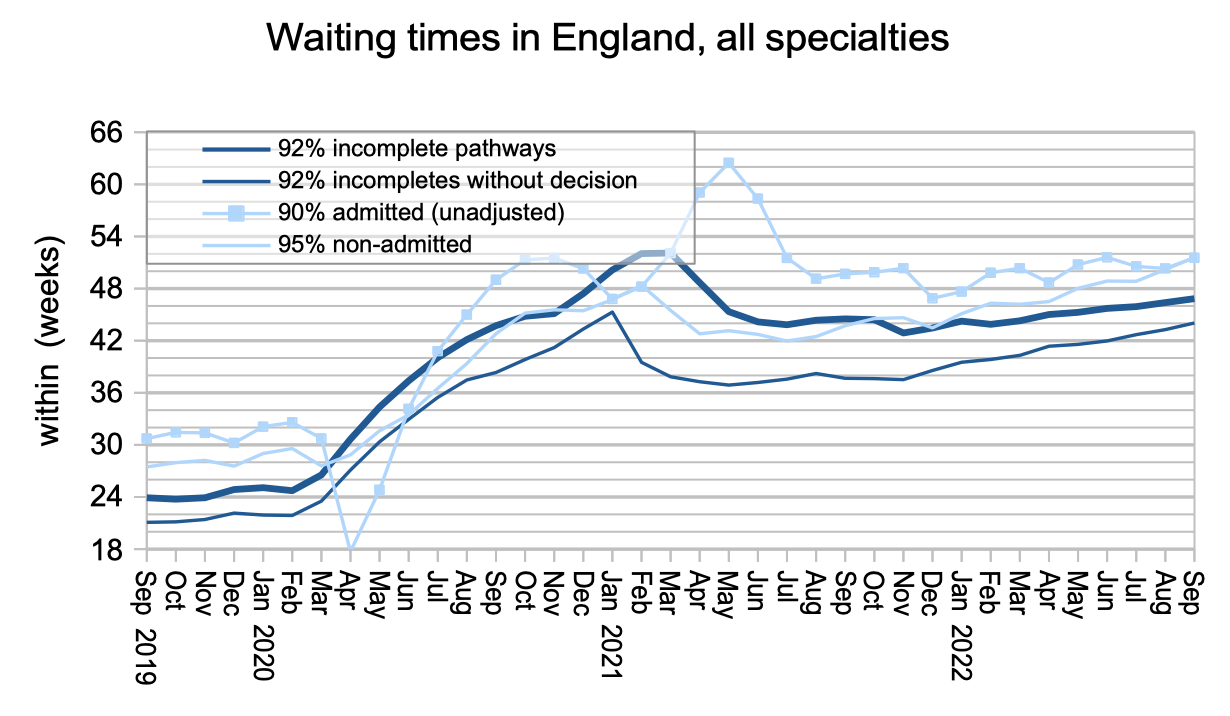
The thick dark blue line in the next chart shows that waiting times from referral to treatment grew from 46.4 to 46.8 weeks in September, and the thin dark line shows that waits from referral to diagnosis and decision grew from 43.3 to 44.0 weeks. (Don’t try to subtract one number from the other to calculate anything, by the way – it doesn’t work like that.)
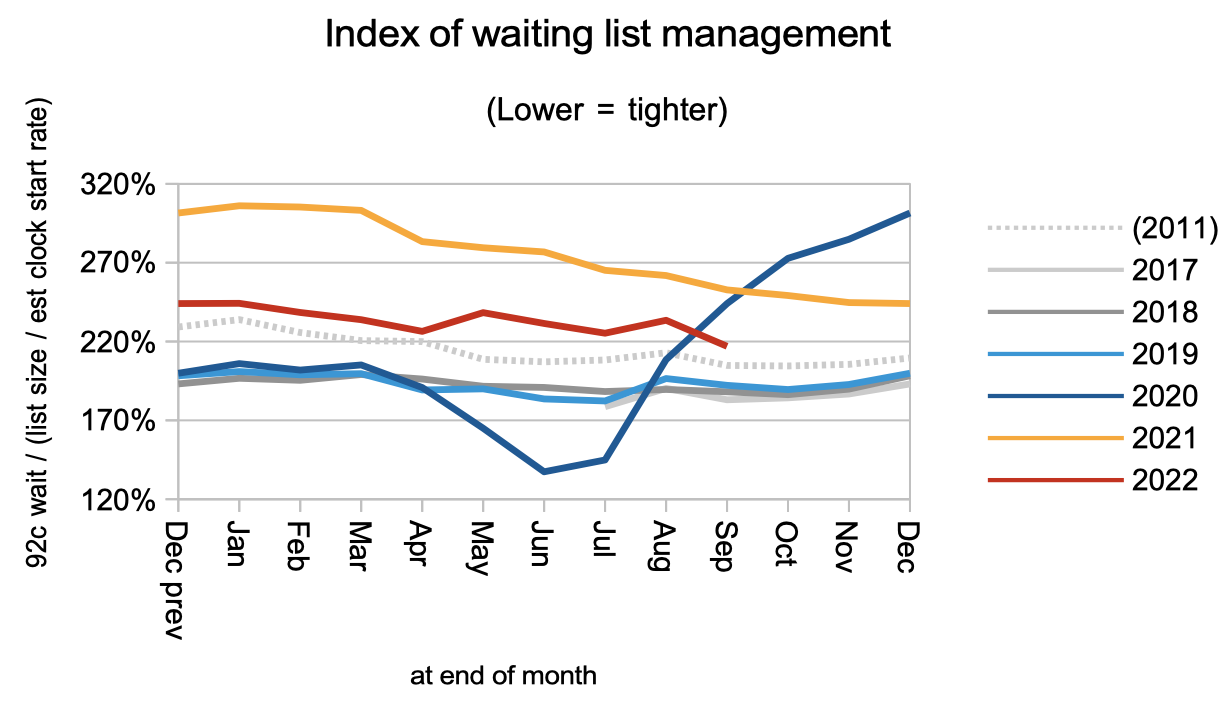
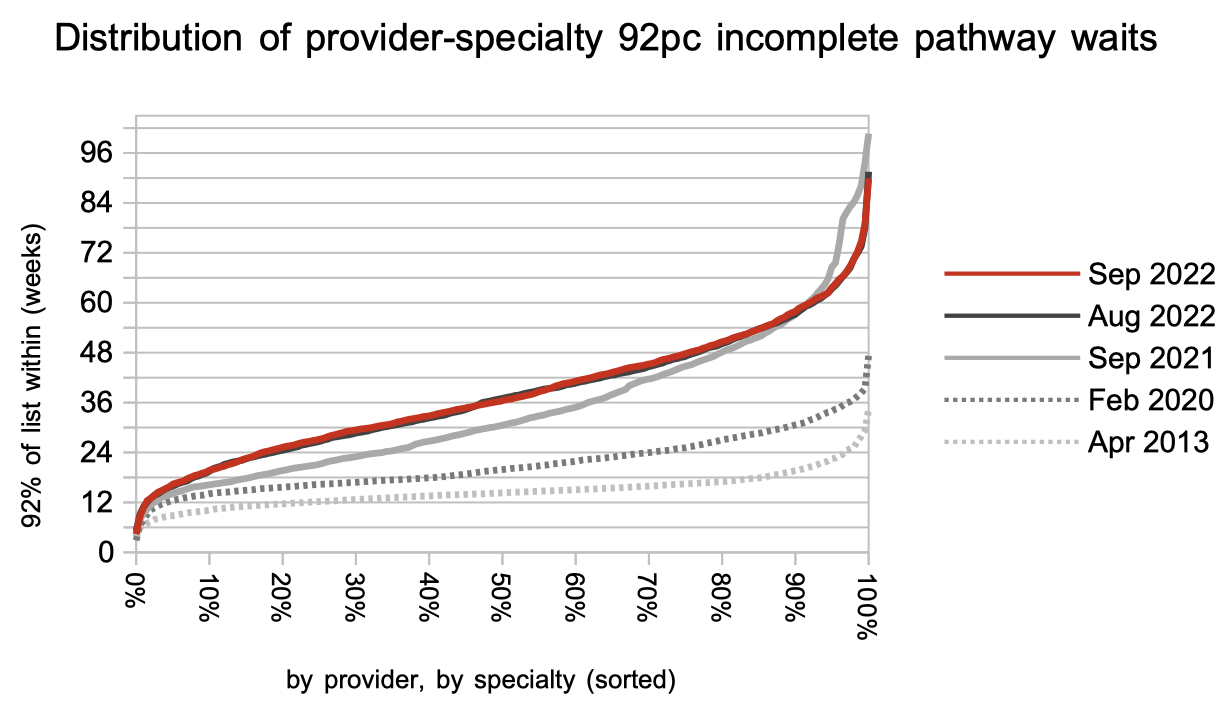
Waiting times are a function of both the size of the waiting list, and the shape which is indicated by the index of waiting list management. The shape of the waiting list remains significantly worse than before the incomplete pathways target was introduced in 2012. The main driver is probably the much larger variation in waiting times around the country, as the distribution chart further down shows.
Looking at waiting times by specialty, several specialties are crowding around the 52 week level, perhaps driven by the current focus to eliminate 78 week waits. Looking lower down on the chart, it is concerning that waiting times are continuing to rise for medical specialties, which tend to have high proportions of clinical priority patients.
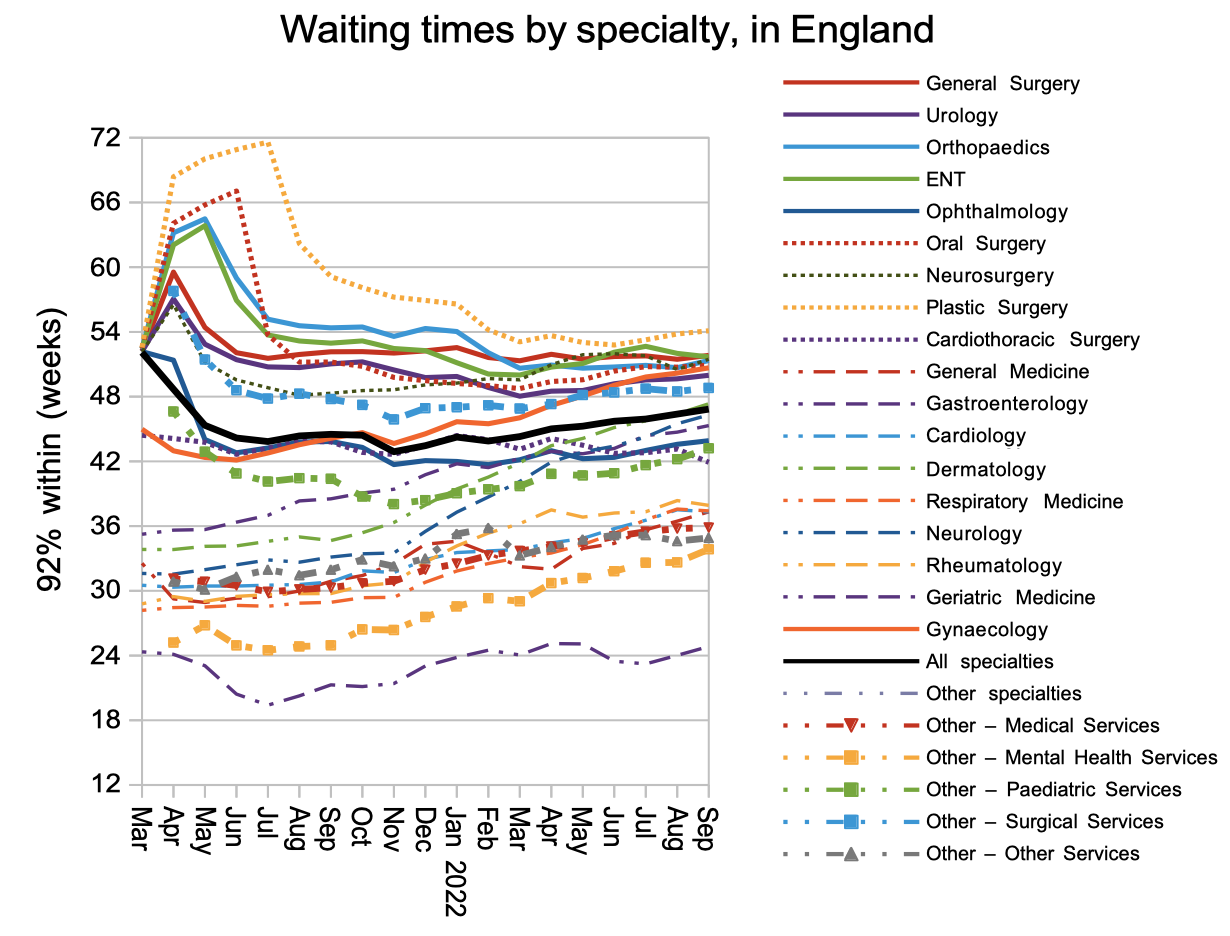
The very longest waits have fallen over the past year, which is a good thing, but the bigger picture is that waits in general have been rising across most of the distribution.
Referral-to-treatment data up to the end of October is due out at 9:30am on Thursday 8th December.