

For the first time, the published referral-to-treatment (RTT) waiting times data for England shows how long patients are waiting all the way up to 104 weeks (about two years). Previously the data maxed out at ’52 plus’ weeks.
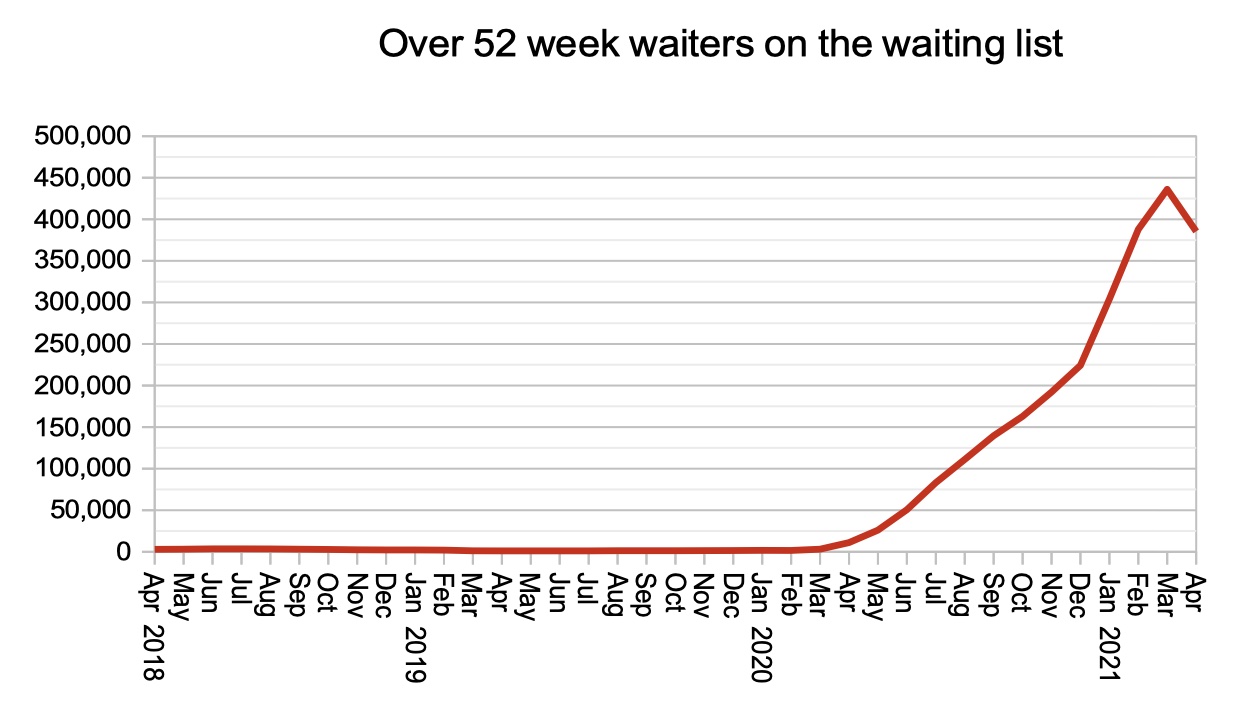
Now we know that, at the end of April, some 2,722 patients were waiting more than 104 weeks. Just over a year ago, before covid, we had fewer patients waiting half as long: at the end of February 2020, only 1,613 patients were waiting longer than 52 weeks.
The number of over 52-week waiters fell in April, but unfortunately we cannot draw comfort from this because it is largely an artefact of the first covid shutdown: fewer patients were referred in April 2020, and that lull is now passing through the 52-week mark. (I said this might happen, back in February.)
So as usual, if we really want to know what is happening, we need to look instead at the whole waiting list. It is growing, because the NHS is currently unable to keep up with demand.
Within that overall picture of rising pressure there are even more serious risks: long-waiting patients with urgent clinical conditions, long-waiting patients without diagnoses, and increasingly unreliable record-keeping. These more serious risks need to be tackled ahead of the eye-catching long RTT waiters, even if that slows the headline recovery. Getting all patients safely to diagnosis and decision, and then reducing the waiting time to treatment, is likely to require significantly more activity for most of the decade.
In the following discussion, all figures come from NHS England and NHS Improvement. If you have a national statistic that you’d like to check up on, you can download our waiting times fact checker.
For analysis of waiting times performance at a particular organisation, visit our reports page, or our map of the latest RTT waiting times across England.
England-wide picture
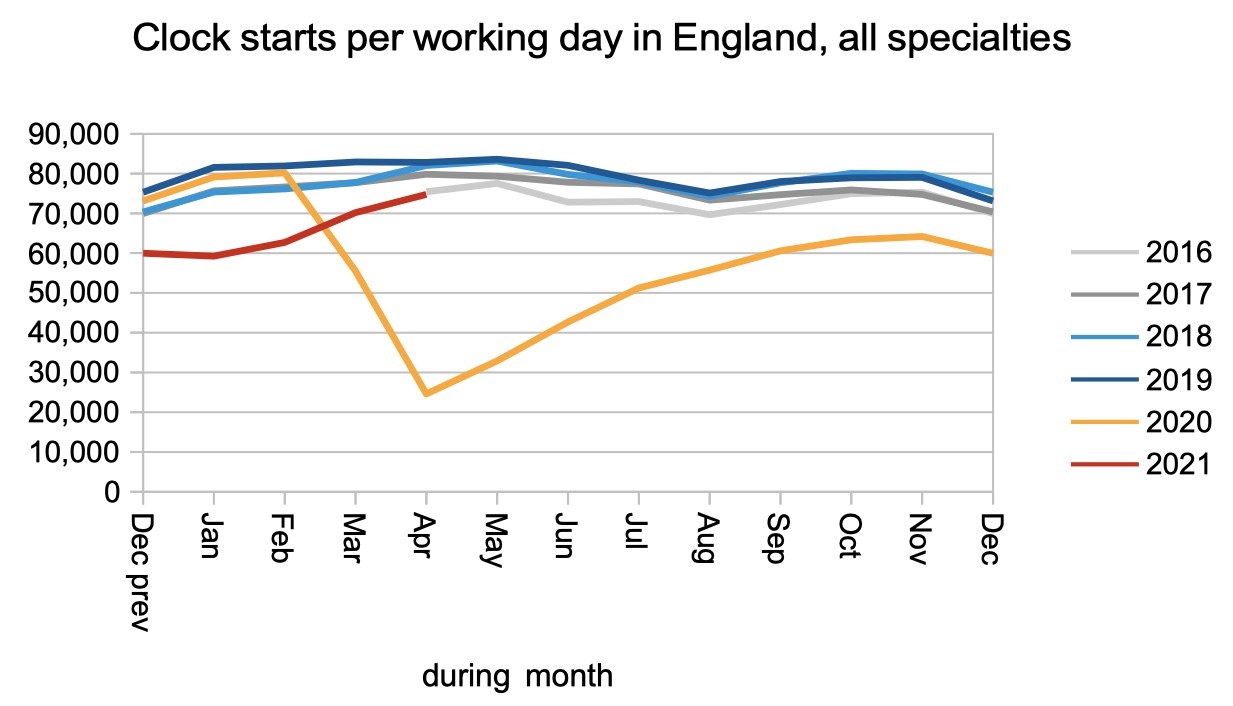
The post-covid recovery continued in April, with referral rates (and therefore the rate that patients started RTT ‘clocks’) approaching pre-pandemic levels. This is not yet a sign that the pent-up demand is coming back – that will only really be underway when referrals exceed pre-pandemic levels.
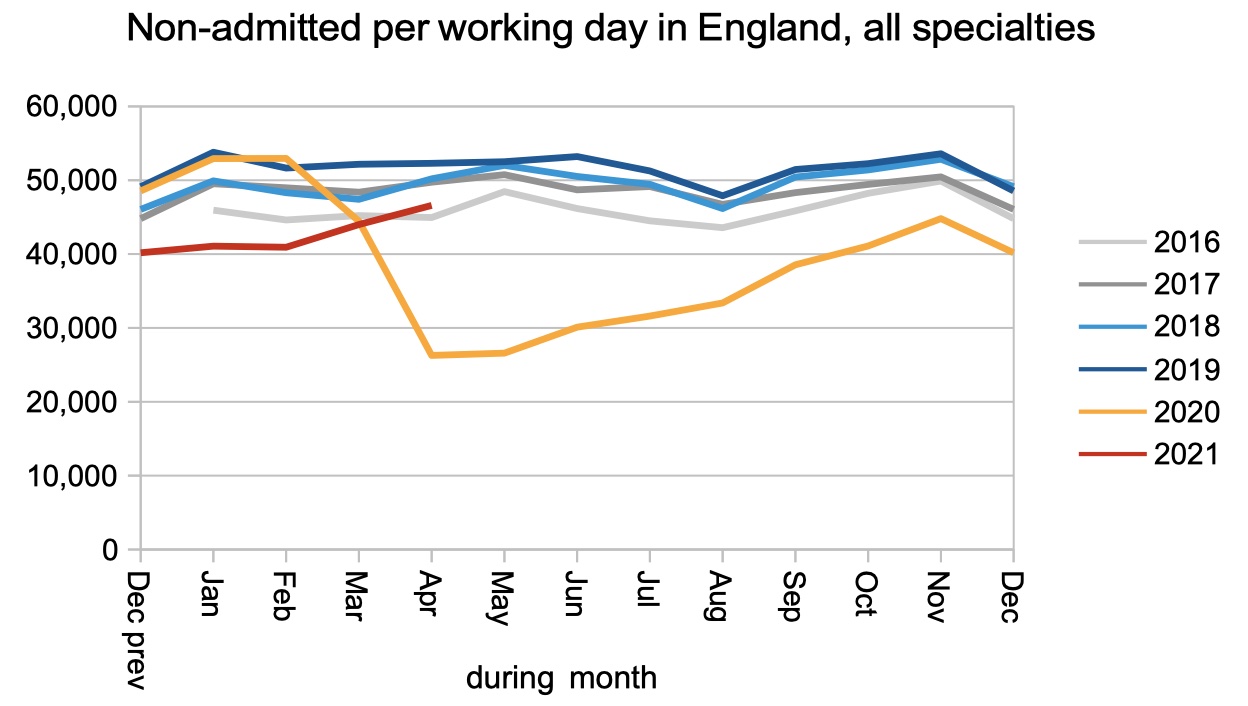
Patients were also discharged from outpatients (non-admitted clock stops, in the jargon) at near pre-pandemic levels in April, in a sign that outpatient capacity is recovering well.
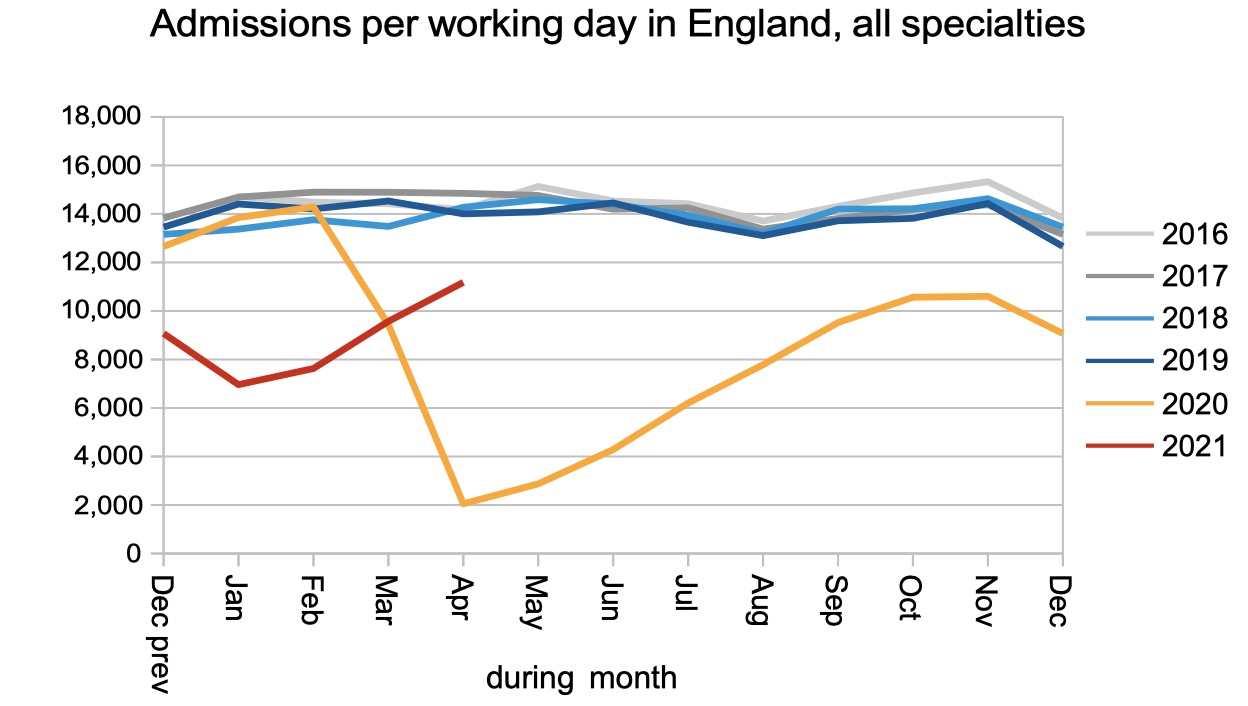
The rate that patients are admitted for inpatient and daycase treatment also continued to recover. This type of work is more difficult while covid infection prevention and control measures remain in place, because it does require patients to come in to hospital, so it is not surprising that admission rates remain well below pre-pandemic levels for the time being.
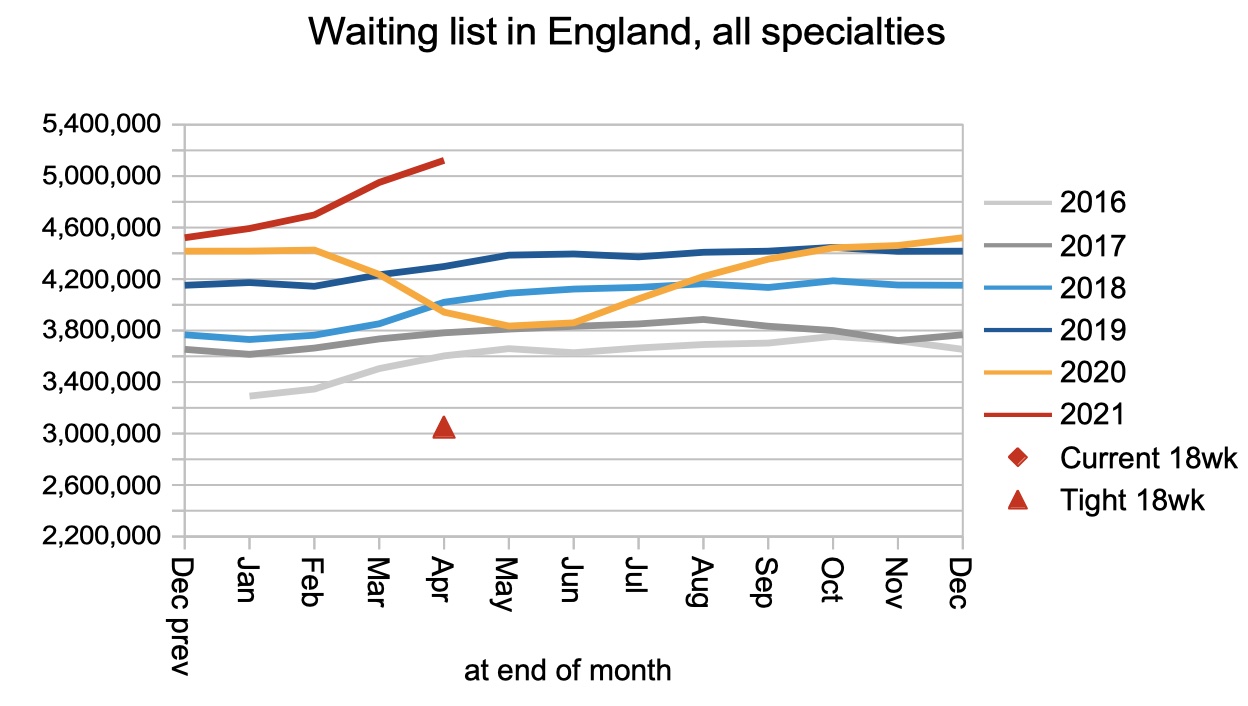
The net result of more patients being added to the waiting list, and more patients being seen and treated from it, was that the waiting list grew rapidly, passing the five million mark for the first time.
Waiting times fell from ’52 weeks plus’ in February and March to 48.7 weeks at the end of April. This is partly a result of activity recovering and the NHS being able to treat more long waiters, and partly because the lull in referrals from the first covid shutdown is reaching its anniversary and passing through the 52-week mark.

One year waits fell, but as noted above this is not a sign that the underlying problem is being fixed. The growing waiting list above tells the true story.
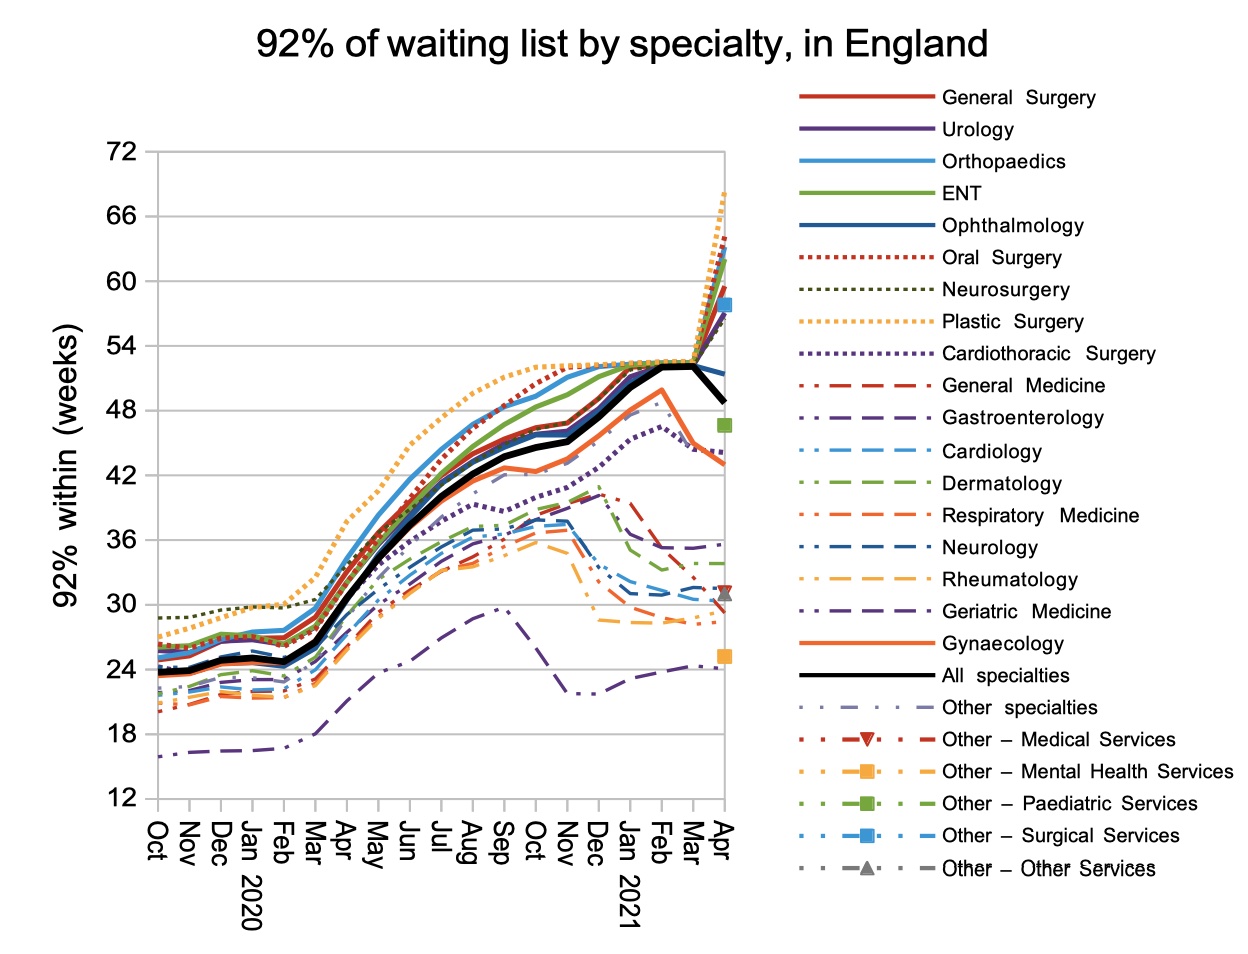
As well as providing detailed waiting times up to 104 weeks, which reveals the very long waits for several surgical specialties, there was another improvement to the published data: a breakdown of the ‘Other’ category. The new detail is shown in the chart below.
Local detail
The proportion of local services that have at least 92 per cent of the waiting list within 52 weeks improved in April, in line with the overall picture on one year waits. Again, this is partly because so few patients tipped over into the ’52 week plus’ category as we reach the anniversary of the first covid shutdown.

In March, many local services were maxed out at ’52 plus’ weeks, and the improved data means we can now see the full distribution of local waiting times.
If the right hand side of this chart is catching your eye, yes, there is one local specialty reporting 104 plus week waits, but let’s give them a chance to check the accuracy of their data because they are not an acute trust and the data does look peculiar.

Referral-to-treatment data for May is due out at 9:30am on Thursday 8th July 2021.