

The rapid growth in patients waiting longer than 104 weeks (from 9,754 to 12,491 patients during September) is an indicator of the intense pressures everywhere in the English NHS.
The NHS rightly attends to the most urgent patients first: emergencies, cancers and other urgent conditions, and patients with rapidly deteriorating conditions. When the going gets tough, difficult choices and trade-offs are made. Nobody wants to keep elective patients waiting longer than two years for treatment, but when the system is struggling to keep up with emergency and urgent demand, something has to give. And ultimately it gives where the least urgent patients are: at the ‘routine’ end of the elective waiting list. The ultra long waiting times we see today are the culmination of other pressures throughout the NHS.
As waiting lists and waiting times grow, a vicious cycle develops. Eventually we reach the point where some patients will never reach the front of the queue. We are there already, which is why the proportionally tiny numbers of two year waiters are proving so hard to deal with.
Short term measures might achieve short term successes: like waiting list initiatives and the validation exercises that the recent planning guidance indirectly incentivised. But those are sticking plasters. Until the root causes of long waits are dealt with sustainably, this problem is going to keep coming back.
What are the root causes? Waiting times at local level are a function of two things: the size of the waiting list, and the order in which patients are booked. The waiting list grows when activity falls short of demand. Elective activity is constrained by how much capacity is available after non-elective demand has been satisfied – especially beds. Therefore sustainable reductions in waiting times depend on the NHS being able to keep up with demand across the board.
In the following discussion, all figures come from NHS England and NHS Improvement. If you have a national statistic that you’d like to check up on, you can download our waiting times fact checker.
For analysis of waiting times performance at a particular organisation, visit our reports page, or our map of the latest RTT waiting times across England.
The numbers
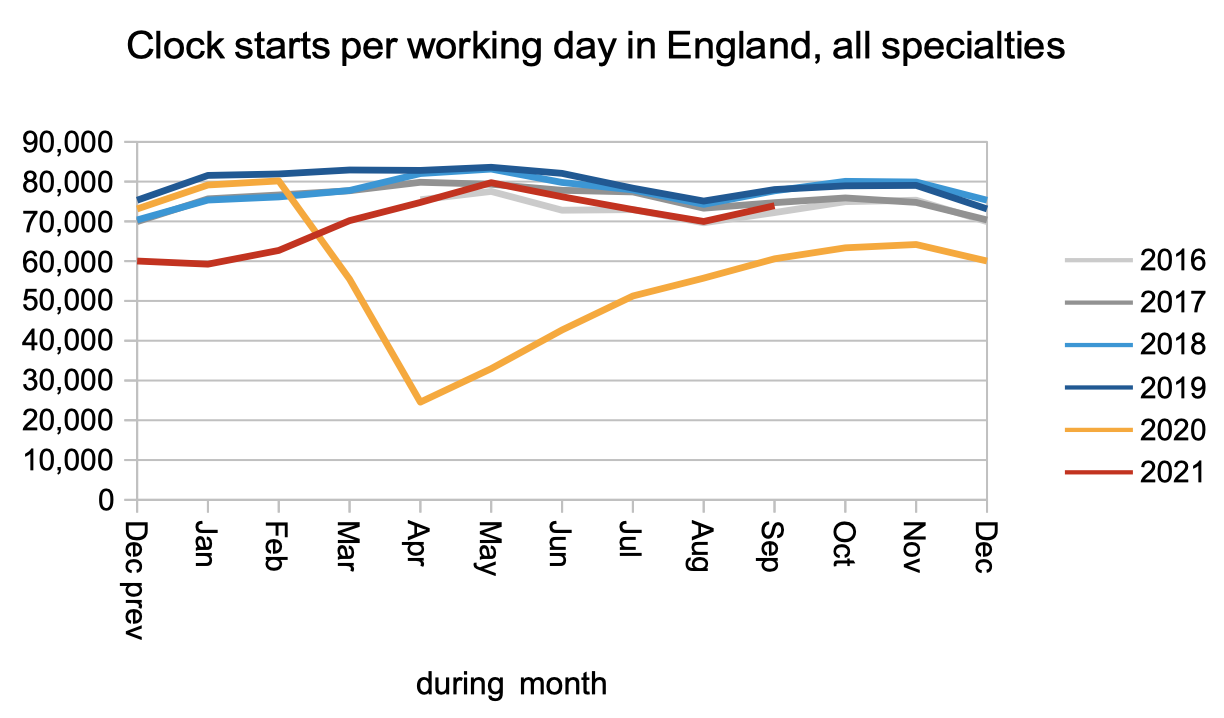
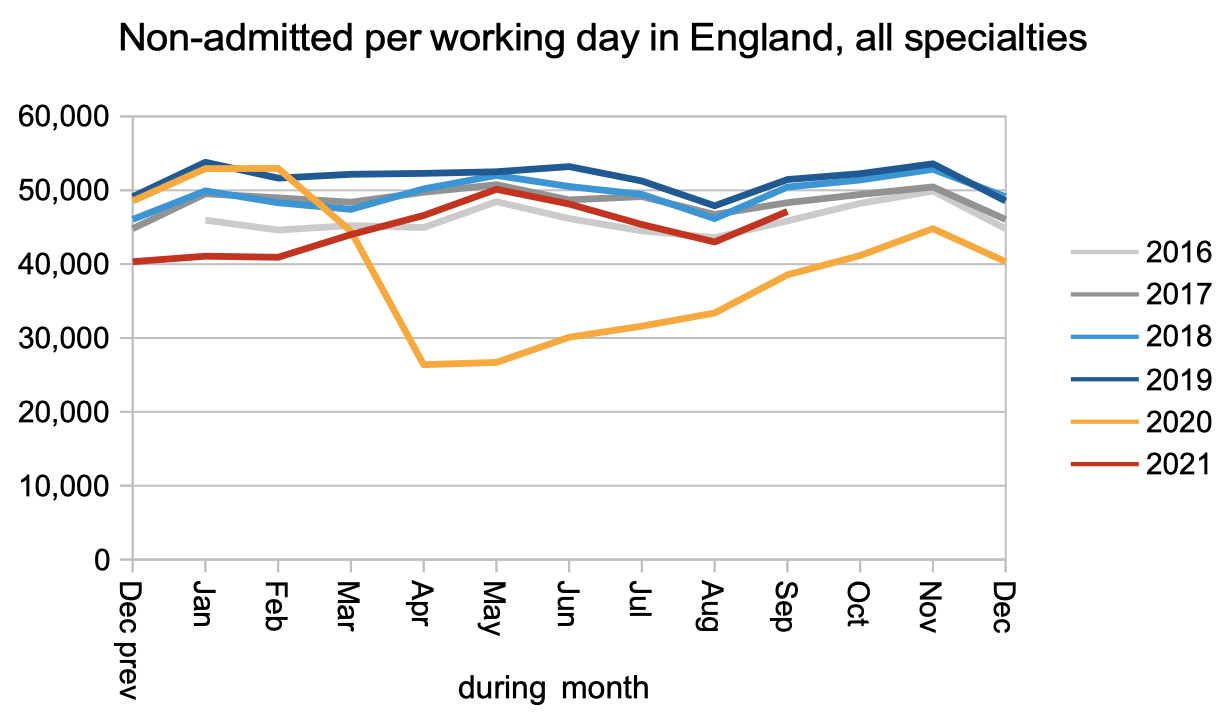
September’s data continues the pattern established since May.
Clock starts continued at roughly pre-covid rates, with no sign yet of a surge caused by pent-up demand during covid.
So did non-admitted clock stops (i.e. discharges from clinic and administrative removals from the waiting list).
Admissions continued to track below pre-covid rates. These are patients who must physically attend hospital and capacity is constrained by covid infection prevention and control measures.
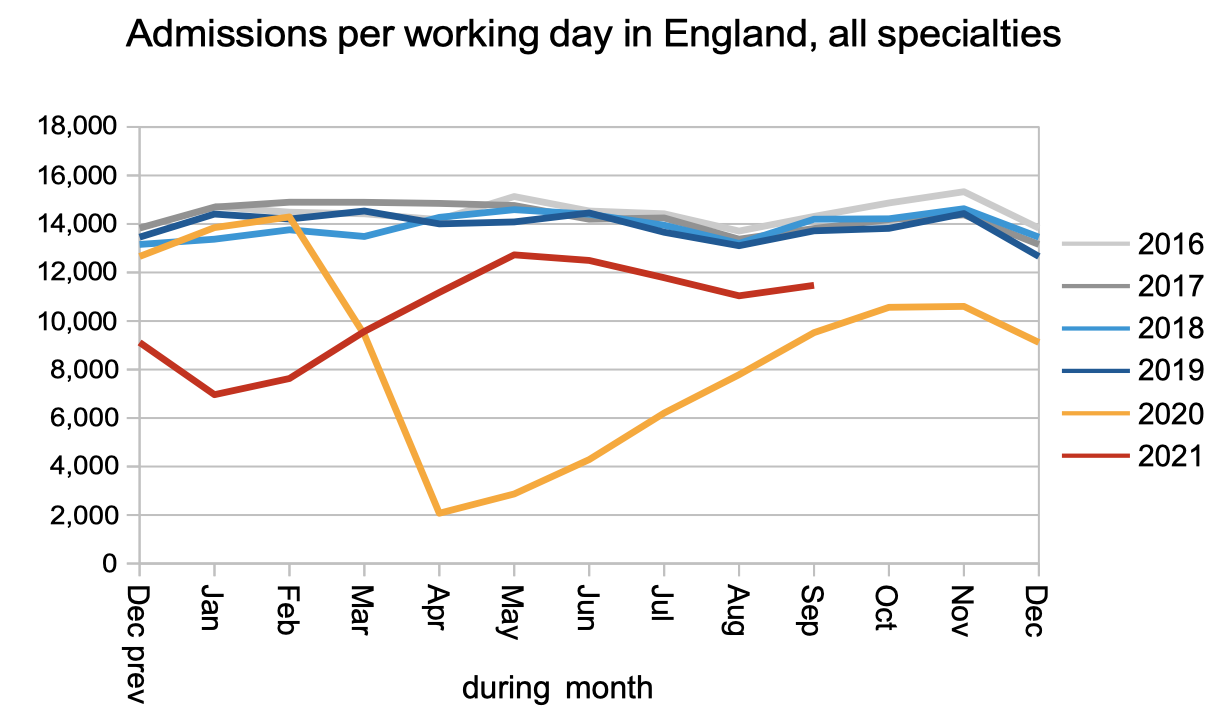
The net result is that activity did not keep up with demand, and the waiting list continued to grow.
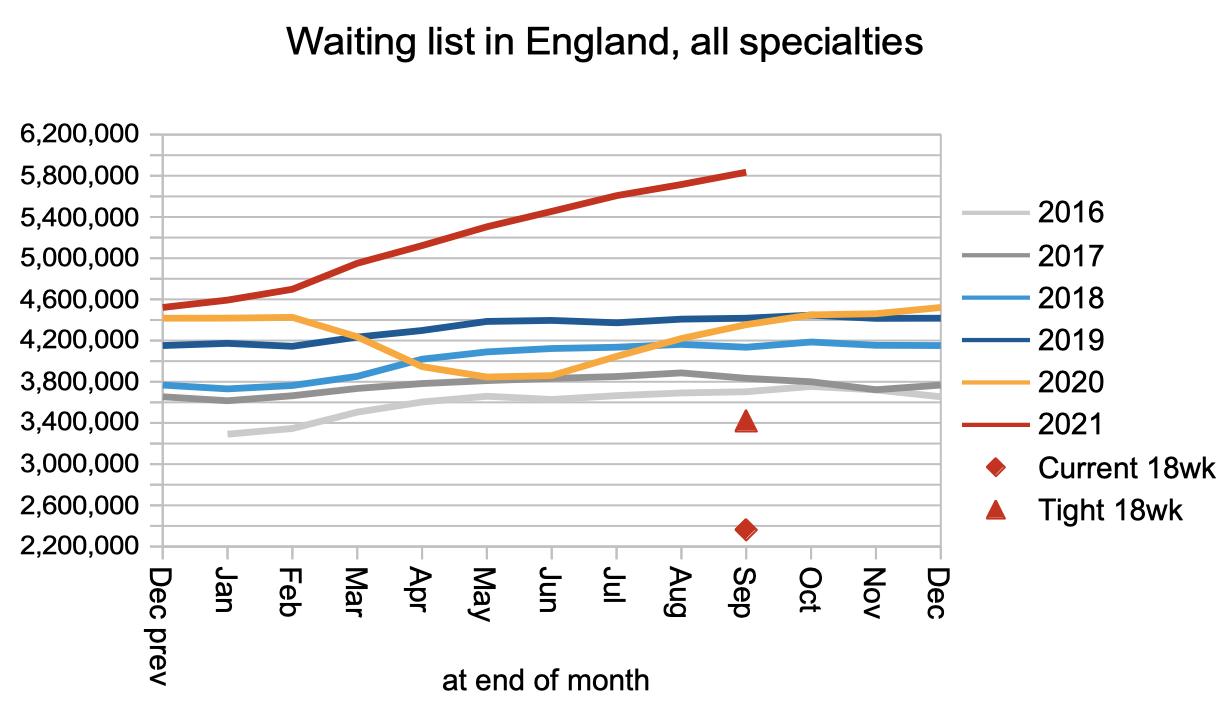
Waiting times remained roughly stable during September, but the growing list is a sign that the underlying pressures are increasing even if they are not showing up as longer waits yet.
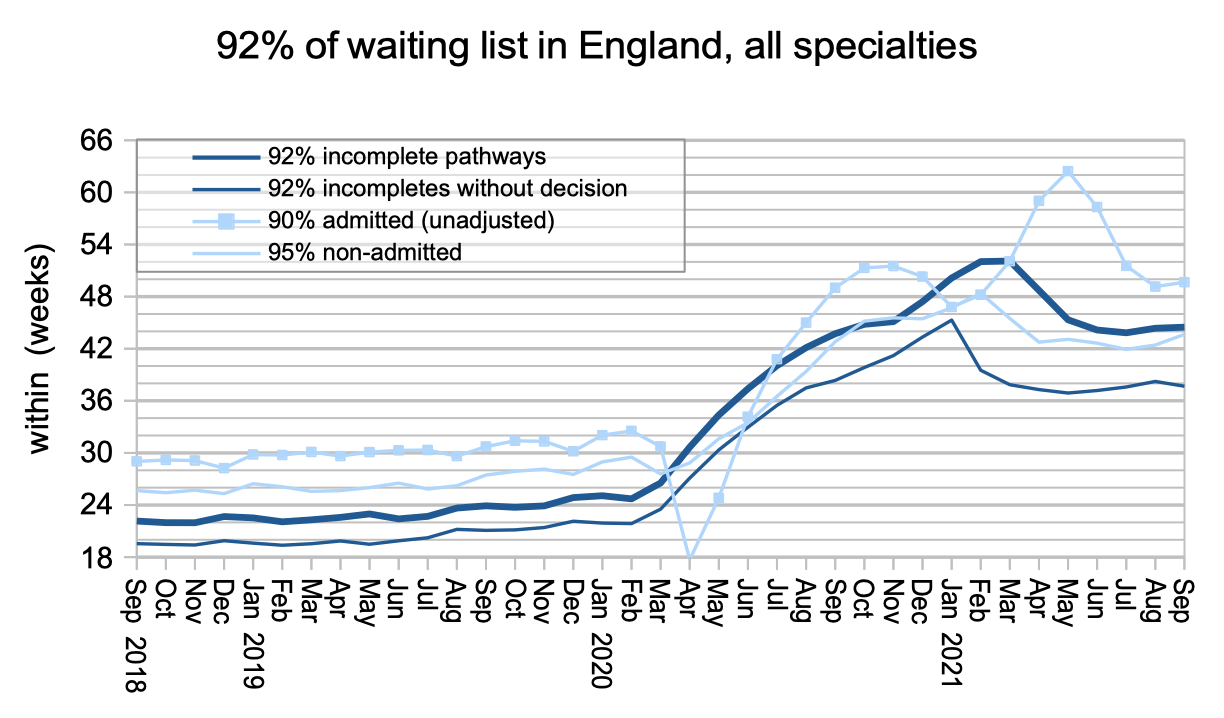
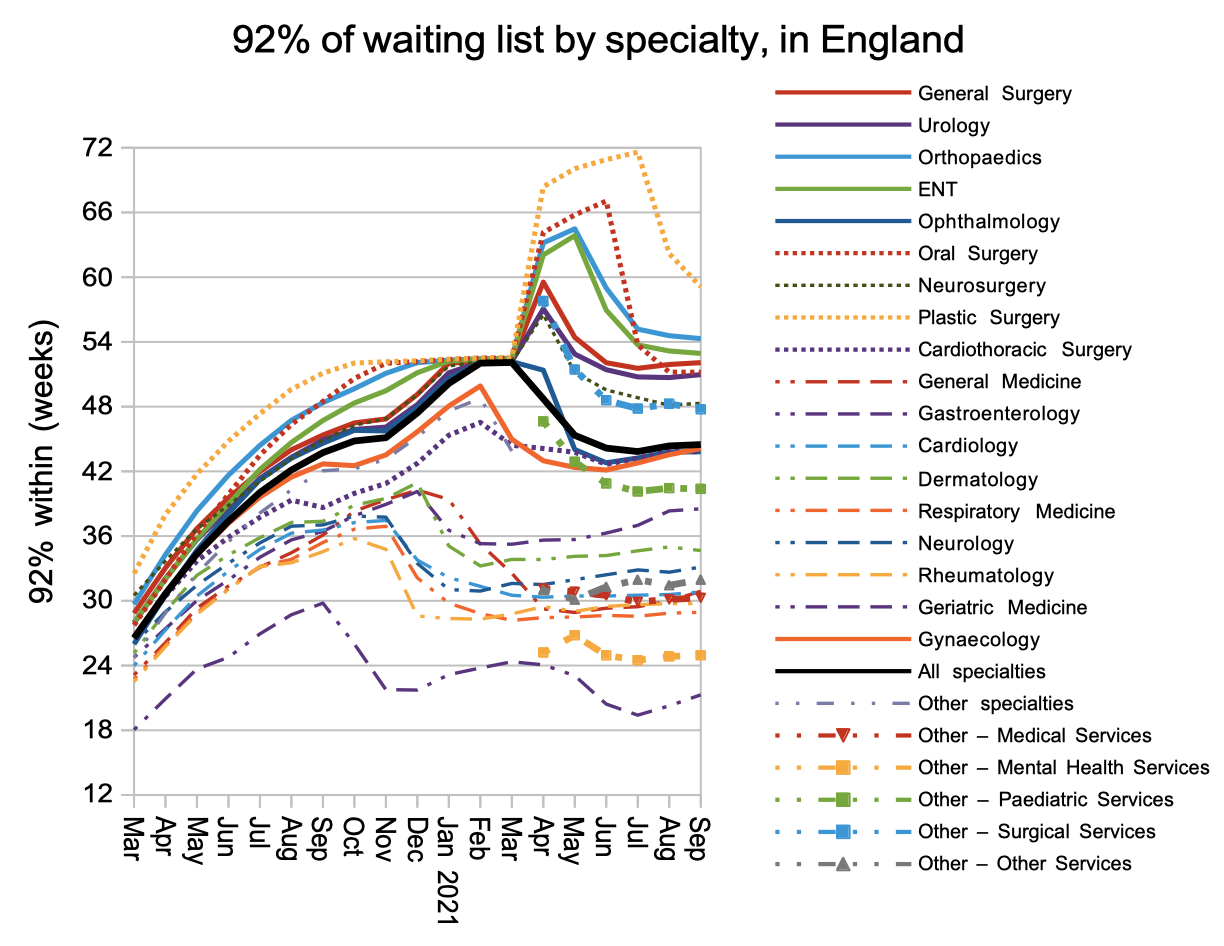
Waiting times were broadly stable at specialty level too, now that the temporary effects of the first covid shutdown have fed through. It is worth remembering, when looking at the chart below, that the NHS is still required by legislation to achieve 18 week waits.
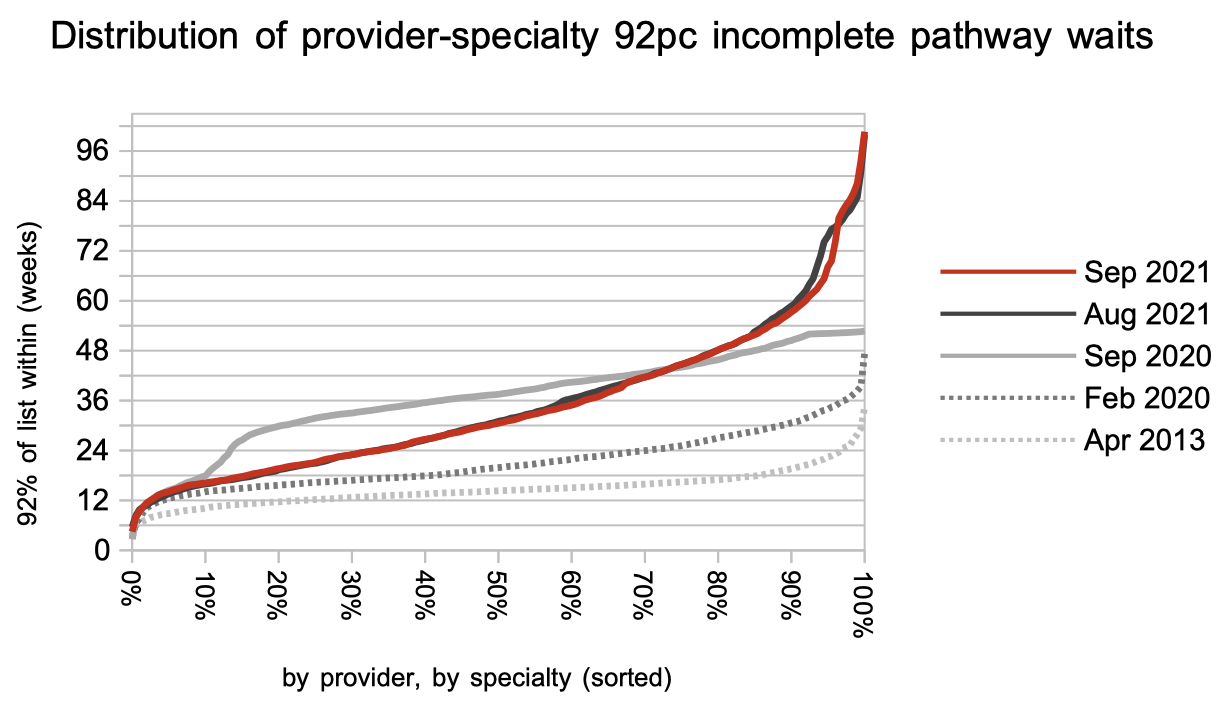
The distribution of waiting times hardly changed during September. The kink towards the right is the remains of the first covid shutdown feeding through the long-waiting end of the list.
Referral-to-treatment data up to the end of October – the first month in which clock stops were incentivised by the latest planning guidance – is due out at 9:30am on Thursday 9th December.