

Referral-to-treatment (RTT) waiting times jumped by 2.3 weeks in December, the sharpest increase since the NHS was emerging from the first covid shutdown back in July.
Demand and activity figures confirm that the elective recovery came to an abrupt halt in December, even before the worst of winter and the third covid wave.
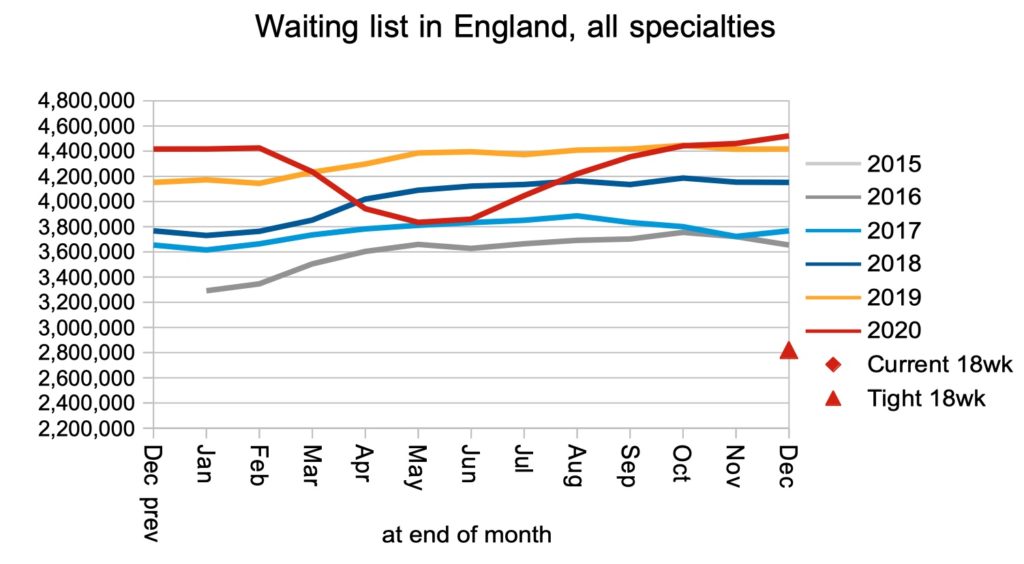
If waiting times now rise by as little as 1.5 weeks in each of January, February and March, which looks very likely, the iconic 52 week level will be breached by the end of the financial year. The statutory target is, of course, only 18 weeks.
What then?
From April, long waits may improve, firstly because the NHS should be able to treat more long-waiting patients as covid and winter ease, and secondly because the lull in referrals from the first covid shutdown will be feeding past the 52-week mark.
However this respite is likely to be temporary. Large numbers of patients have been avoiding the NHS during covid, and many are expected to return. This will cause a dramatic increase in the size of the waiting list, and push waiting times up.
After that, waiting times will only recover when the NHS is able to keep up with elective demand again. As it was unable to keep up with demand even before covid, the prospects of recovery are currently slim.
In the following discussion, all figures come from NHS England and NHS Improvement. If you have a national statistic that you’d like to check up on, you can download our waiting times fact checker.
For analysis of waiting times performance at a particular organisation, visit our reports page, or our map of the latest RTT waiting times across England.
England-wide picture
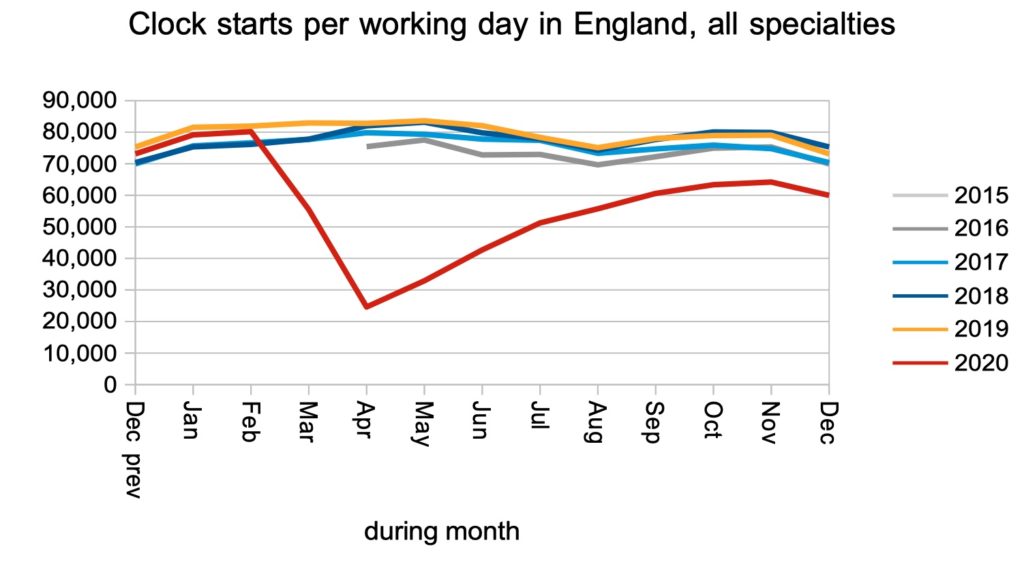
Clock starts (which measure the demand for consultant-led elective care) dipped dramatically during the first covid shutdown, and since then have been recovering. This recovery stopped in December as referrals dipped without closing the gap on the previous years.
Many of the missing referrals from 2020 are expected to return as the NHS emerges from covid restrictions, and this is sometimes referred to as ‘pent-up demand’ or the ‘hidden backlog’. When it does, we can expect demand to be higher than in previous years, and for the waiting list to grow.
The recovery in non-admitted clock stops (the numbers of patients discharged from clinic or administratively) also stopped in December…
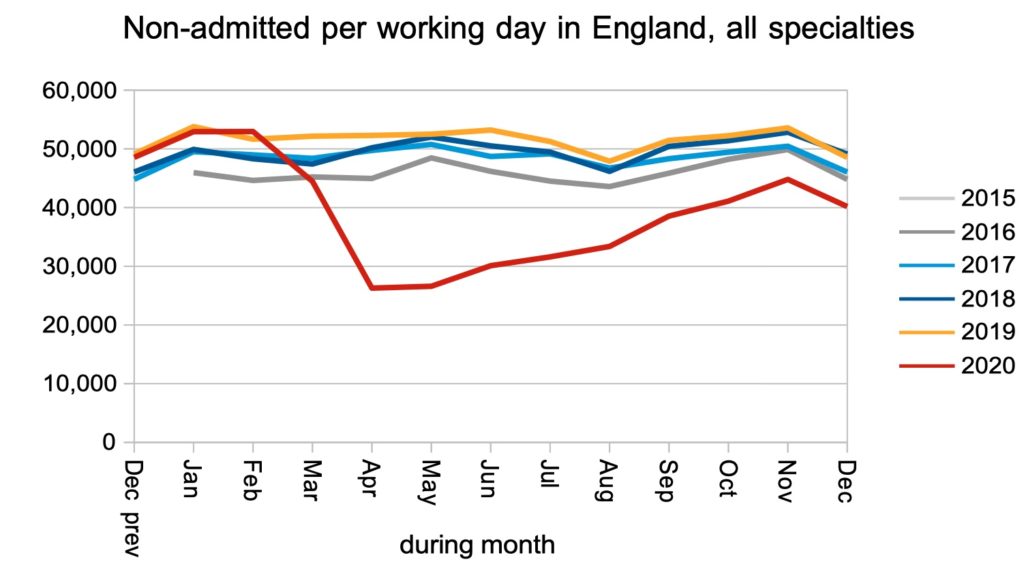
…as did the recovery in admissions for inpatient or daycase procedures.
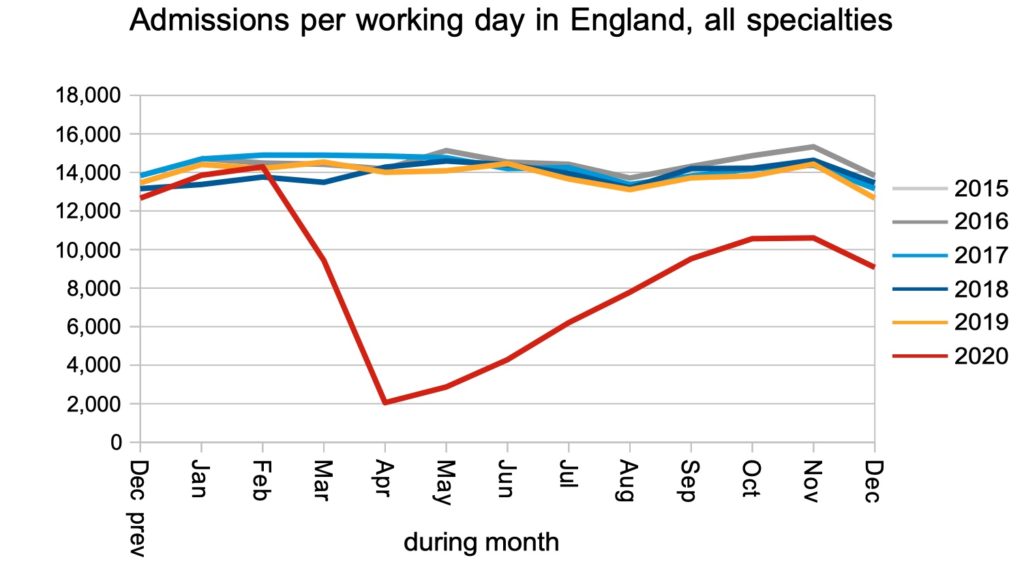
The net result of these clock starts and clock stops was a slight increase in the size of the waiting list.
The rise in waiting times during December was 2.3 weeks, much faster than the 0.5 week rise in November. You have to go back to July (2.7 weeks) to find faster waiting times growth since the onset of covid restrictions.
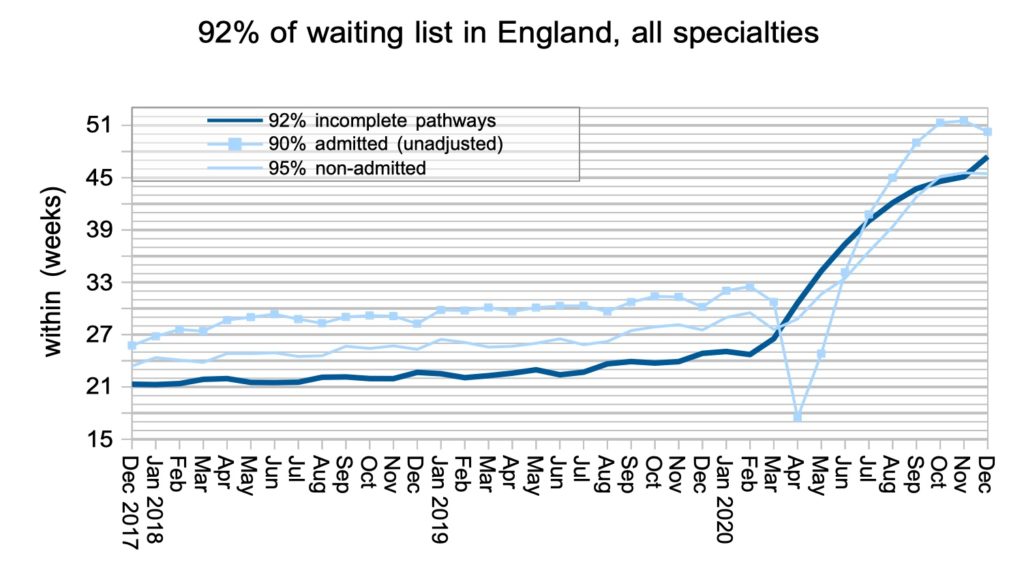
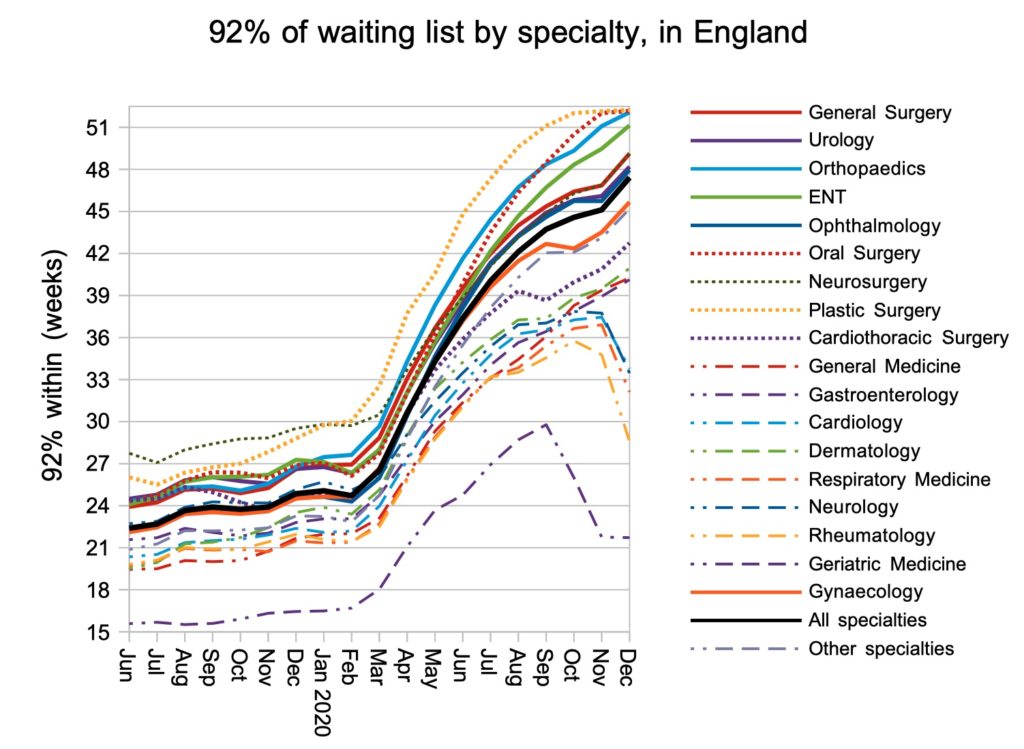
Some medical specialties (which are mainly outpatient-based) reduced their waiting times at national level in December, but surgical specialty waiting times were sharply up.
Plastic surgery, oral surgery and orthopaedics have all maxed out at 52 weeks plus, which is the highest waiting time category in the published figures. NHS England know how long these patients are really waiting, and it would be helpful if they shared this knowledge with taxpayers.
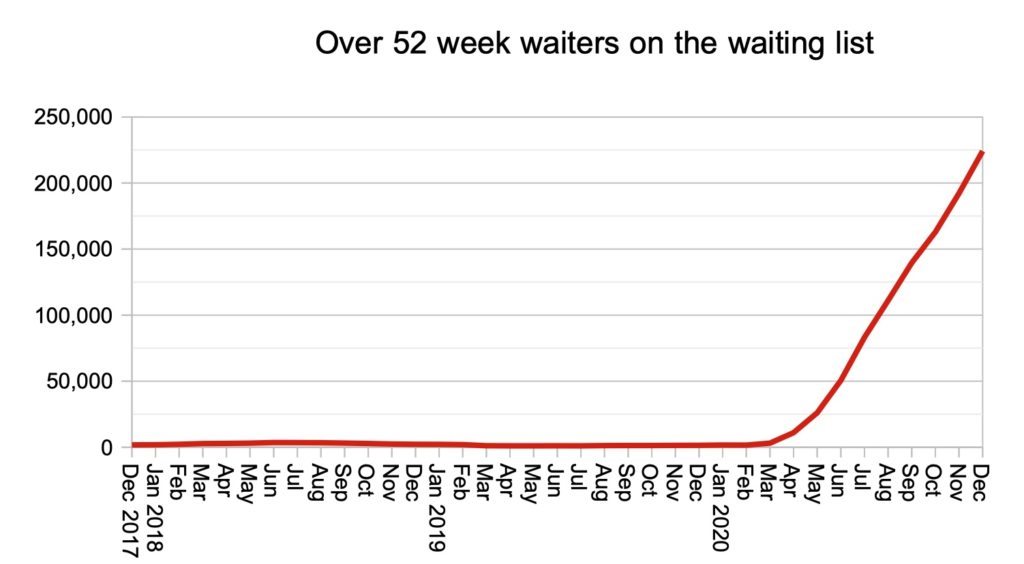
Which brings us to the number that media organisations like to highlight: the number of patients who have been waiting over a year for treatment. Although it’s an eye-catching number, and a devastating one, it doesn’t help patients understand how long they can expect to wait. Which is why I prefer to focus on the waiting times that most patients are experiencing, not the numbers who happen to be waiting longer than some arbitrary time.
Local picture
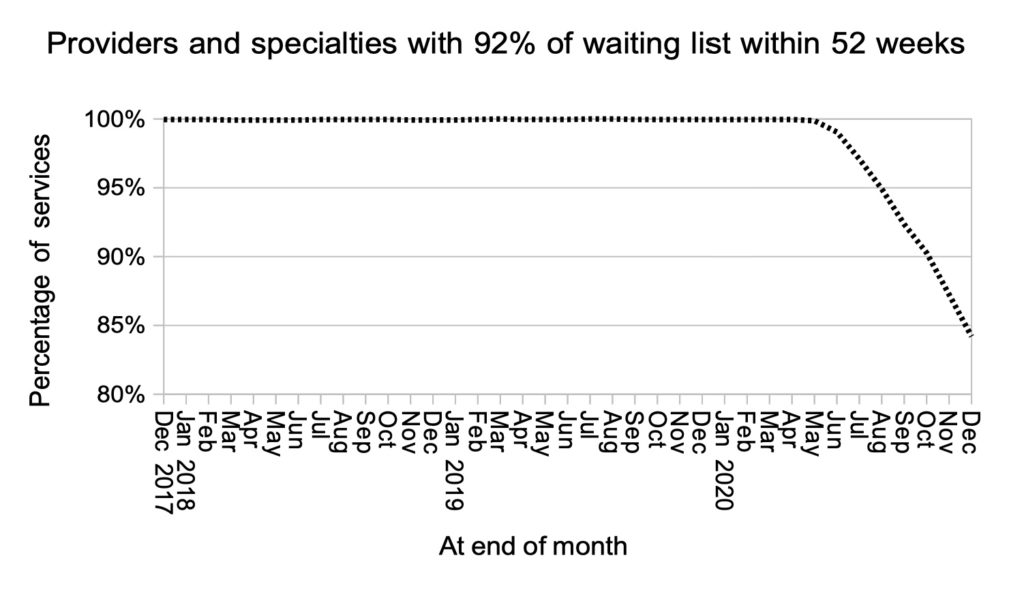
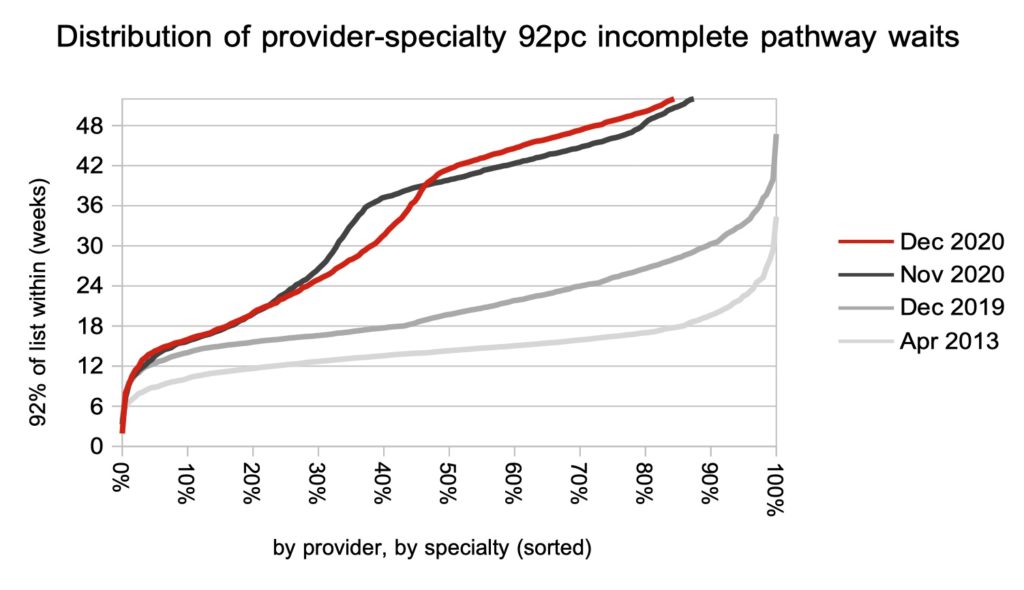
Nevertheless, 52 weeks is the iconic marker of excessively long waits, and (as noted above) the published data does not reveal what is happening beyond it. Looking at the data by specialty, by provider, we can see that the proportion of local services achieving 92 per cent within 52 weeks is continuing to drop sharply.
Looking at the breakdown of local waiting times, we can see some improvement in the middle (consistent with the improvements in some medical specialties noted above), with continued lengthening of the longer waiting times.
Referral-to-treatment data for January 2021 is due out at 9:30am on Thursday 11th March 2021.