

March ended with a reported 10,737 patients still waiting more than 78 weeks after referral. So NHS England’s target “to eliminate waits of over 18 months by April 2023” has been officially missed, as the Secretary of State trailed in the House of Commons on Tuesday when he said “18-month waits have now decreased by over 90% since their peak in September 2021” (as opposed to “have been eliminated”).
Analysis produced for Health Service Journal by Dr Rob Findlay, Director of Strategic Solutions at Insource Ltd and founder of Gooroo Ltd
The targets get tougher from now on. Not just because they are ratcheting down – the remaining targets are to eliminate waits of over 65 weeks by March 2024, and of longer than a year by March 2025 – but because they are closing in on the shortest safely achievable waiting times in an increasing number of local services, given the size of their waiting lists.
Those services will not achieve these targets with the usual approach: targeting cohorts of long-waiters. Instead they will need to tackle the root causes of long waits: reducing the waiting list to a sustainable size, booking patients in the right order, keeping patients involved during their wait, having accurate data, streaming patients to the right pathways, and ensuring that all activity helps to progress patients efficiently towards their diagnosis and treatment.
These are basic waiting list management skills that have atrophied in recent years, and the next few months will be a good time to rediscover them, before the pressure to start firefighting the next target starts to build in earnest. The phrase increasingly heard from NHS England is “getting the basics right”, and they have chosen the topic well.
In the following discussion, all figures come from NHS England. For analysis of waiting times performance at a particular organisation, visit our reports page, or our map of the latest elective waiting times across England.
The numbers
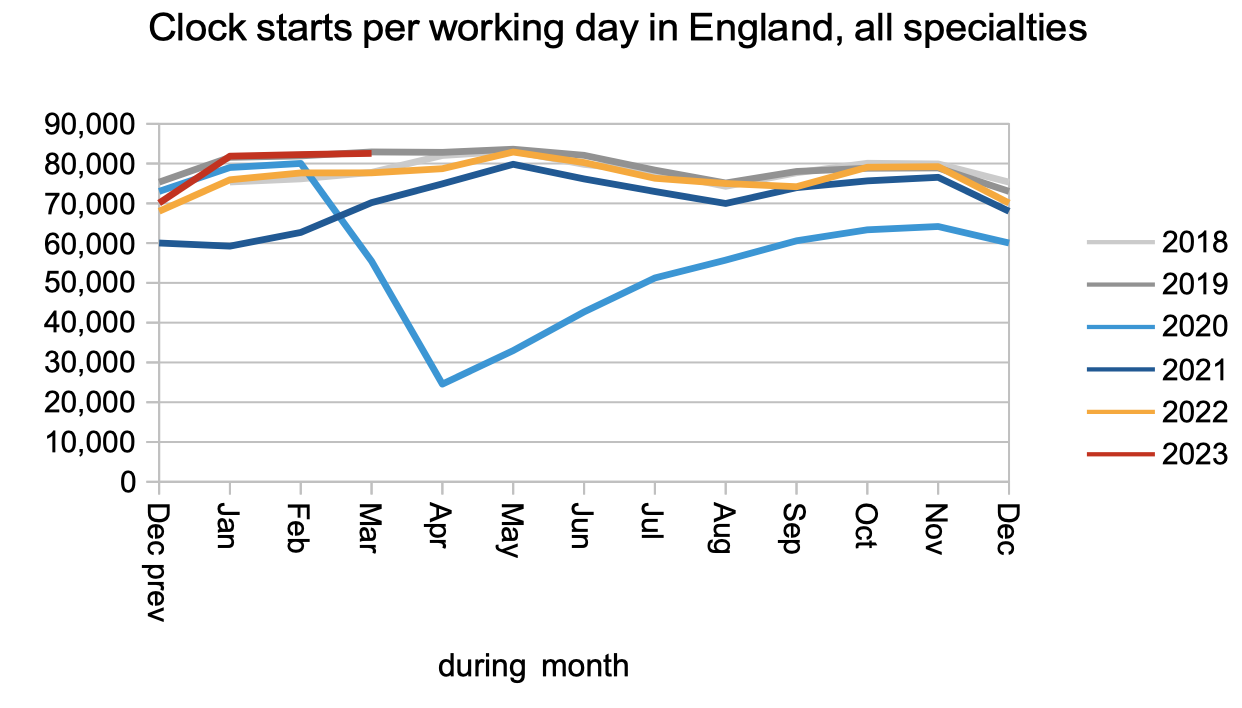
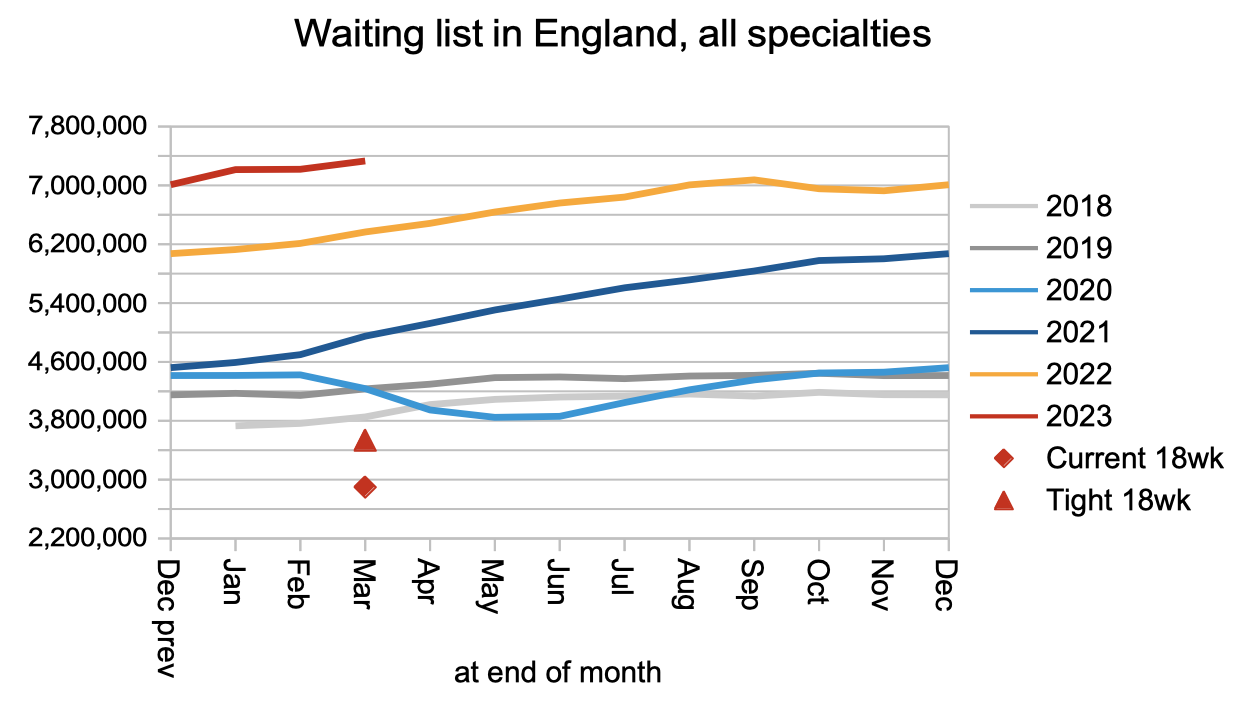
The demand for elective care, measured by patients starting new waiting time ‘clocks’, remained at pre-pandemic levels in March.
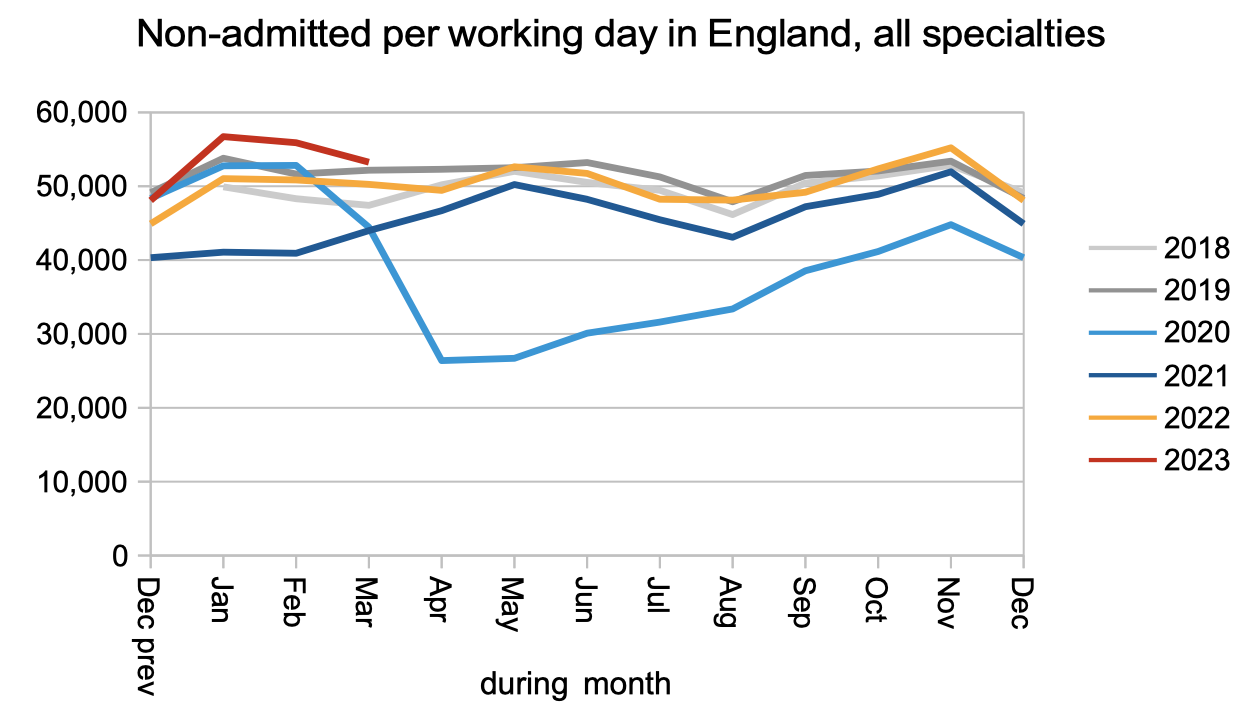
The numbers discharged without being admitted for treatment – mostly discharged from outpatients or otherwise removed from the waiting list – remained better than pre-pandemic levels. There was a junior doctors’ strike in March which may explain some of the dip relative to February.
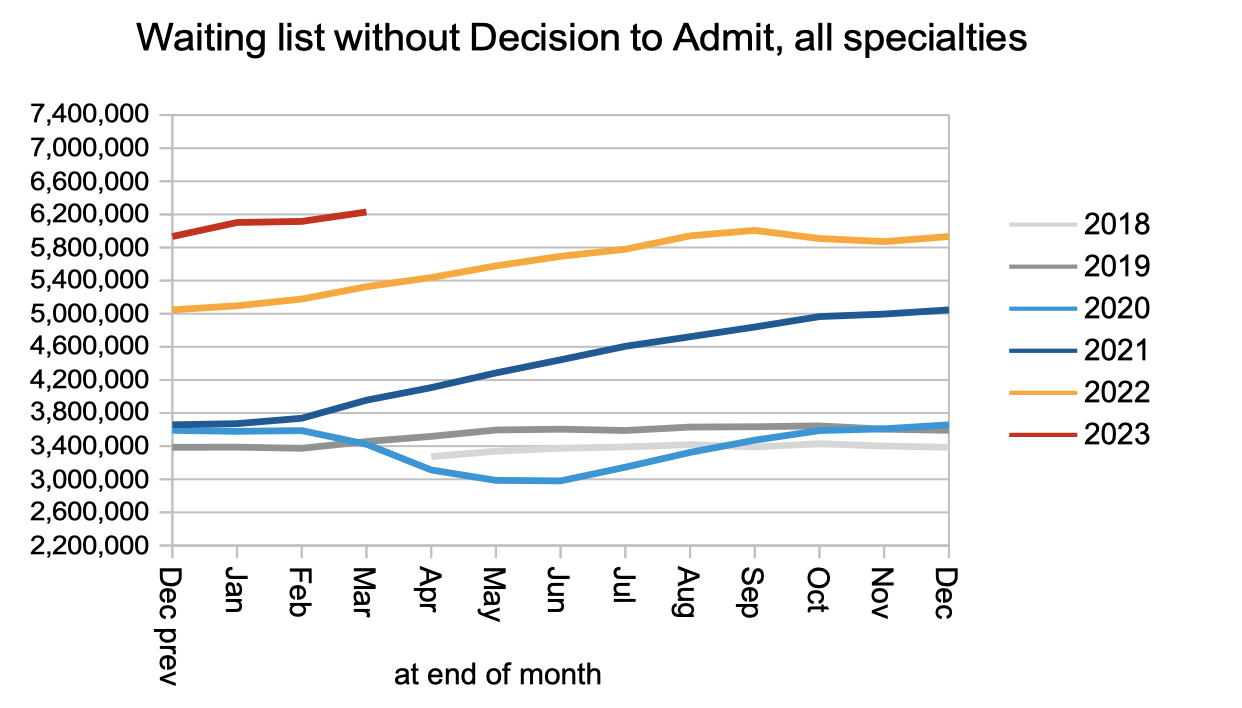
The net result of pre-pandemic demand, and non-admitted activity only slightly above pre-pandemic levels (bearing in mind that the waiting list was growing before the pandemic too), was a steadily growing waiting list of those patients who do not yet have a diagnosis and decision to admit. I estimate they include some 26,500 who will turn out to have cancer, but are not on a cancer pathway because it is not yet suspected.
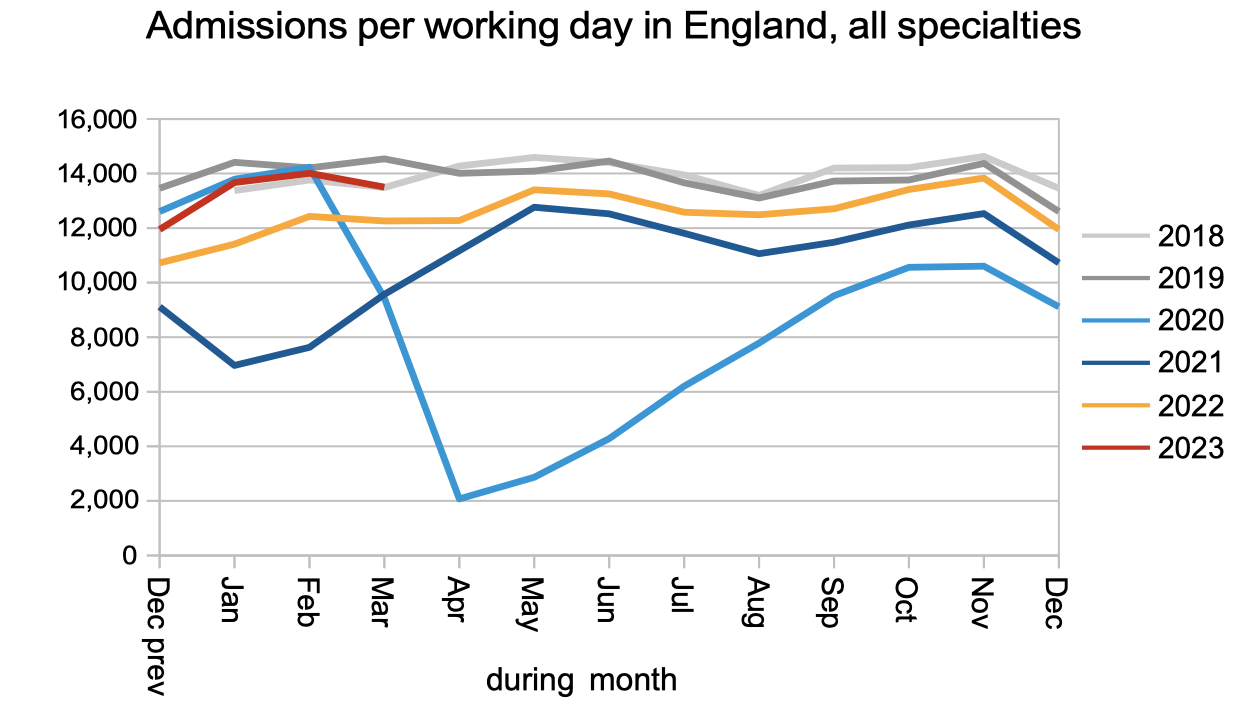
Admissions for treatment as an inpatient or daycase were below pre-pandemic levels in March.
Looking at the whole of the referral-to-treatment (RTT) waiting list, which includes patients with as well as without a decision to admit, the waiting list grew to a new record of 7.3 million patient pathways. This is politically important because on 4th January the Prime Minister said “NHS waiting lists will fall” as one of “five immediate priorities”, which clearly is not yet happening.
Patients care about how long they will wait, not how many other patients are waiting alongside them, and the next chart shows our best available measures of the typical waiting times from referral to diagnosis/decision (43.3 weeks), and the overall wait from referral to treatment (45.6 weeks). I am still not tired of pointing out that 43.3 weeks (10 months) is far too long to wait for a diagnosis and decision if you are one of the estimated 26,500 patients who have cancer but are not protected by the cancer waiting time targets because it is not yet suspected.
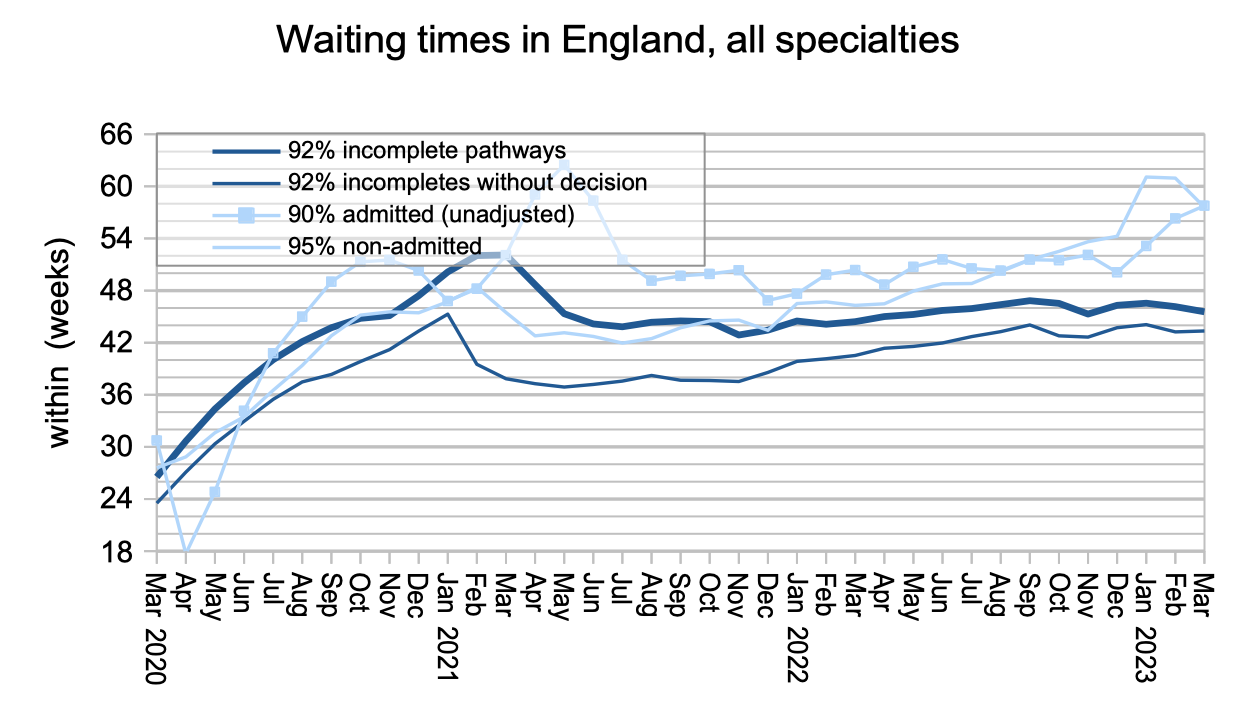
Waiting times are a function of both the size and shape of the waiting list, and the chart below shows that the shape has been improving but remains significantly worse than pre-pandemic, largely because of the variation in waiting time pressures between different services.

In March the slight improvement in overall RTT waiting times was seen in nearly every specialty at national level.
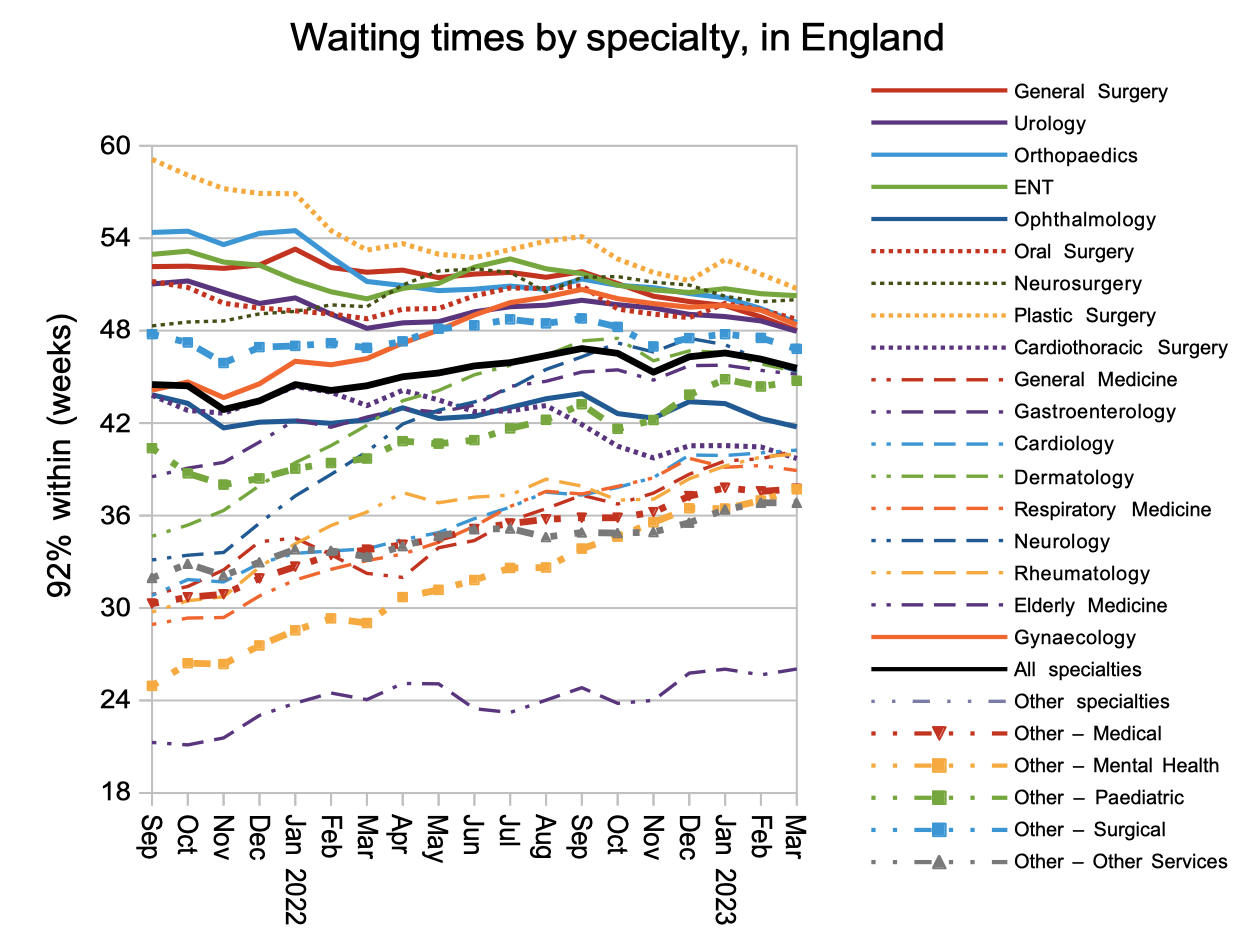
Looking at the waiting times in each of the 2,500-odd local specialties around England, the longest waits have come down over the last year but waiting times in the middle have generally gone up, in line with the convergence at specialty level seen in the chart above.
