

This is the full analysis version of the summary originally published in the Health Service Journal.
Independent analysis by Dr Rob Findlay, Director of Strategic Solutions at Insource Ltd and founder of Gooroo Ltd
NHS England created some new referral-to-treatment (RTT) ‘ambitions’ in their plan for clearing the post-pandemic elective backlog, back in February 2022. The target to eliminate two year (104 week) waits was narrowly missed in July 2022, and still has not been fully achieved. The target to eliminate 18 month (78 week) waits was missed by ten thousand patients at the end of March 2023.
In this analysis I will show why the next two targets – to eliminate 65 week waits by March 2024, and 52 week waits by March 2025 – will be much harder to achieve than the ones already missed, not just because the target is ratcheting down, but because so many local NHS services (individual specialties within individual hospital trusts) have waiting lists that are far too large to achieve the next targets safely.
Progress to date has not made the task much easier, and this points to a disadvantage of the NHS’s primary approach to delivering these targets: drawing up lists of those patients who are set to breach the next target, and getting those named patients treated or discharged before the deadline.
This is often an effective way of closing in on a numerical result on target day. But it leaves the rest of the system relatively neglected, so it neither paves the way for sustaining the result, nor for achieving the target that comes after that, nor (on its own) does it address any of the root causes of long waits. That is not to say that the NHS completely ignores all of those root causes, but I would argue that they get insufficient attention and that is why we are in this position today.
Safely achievable waiting times
In this analysis I will distinguish between four categories of local NHS services, based on their current size of waiting list and proportion of patients treated urgently. Those that:
- Could achieve the next targets safely and probably would;
- Could achieve the targets safely but probably wouldn’t;
- Probably would achieve the targets but using severe and potentially unsafe methods;
- Could not and probably would not achieve the targets.
We can easily tell from the data which local services are actually achieving different targets. But some modelling is needed to distinguish between those services that could achieve the target safely with the current size of waiting list, and those that could not.
I do not know of any model that can accurately assess whether ultra long waiters can be ‘eliminated’, and there are two reasons why this is difficult: firstly, there will always be some random events, such as unexpected cancellations, that cause a few unlucky patients to wait much longer than expected; and secondly, today’s very long waiting times are sensitive to a wide range of shifting and uncertain clinical, social and operational priorities that affect the whole waiting list.
So I will model instead the 92nd centile waiting time, which is relatively more stable, and is already familiar as the basis for the statutory target that 92 per cent of the RTT waiting list should be within 18 weeks.
Headroom below the ‘eliminate’ target
Clearly some headroom will be needed between the 92nd centile waiting time and the ‘eliminate’ target that needs to be met. I’ll estimate a suitable amount by looking at how local services actually performed on the last day of March 2023, which was the target deadline day for eliminating 78 week waits.
Filtering more than 2,000 local services across England, to those where:
- the RTT waiting list was not tiny – at least 100 patient pathways at the end of March 2023;
- they were separately reported specialties, i.e. excluding the ‘Total’ category;
- the service successfully eliminated over 78 week waits on 31st March;
- but it was a close shave – the longest-waiting remaining patient was over 75 weeks.
Among the 318 local services that fit those criteria, we find a wide span of 92nd centile waiting times:
- Minimum of the 92nd centiles: 11 weeks (yes, really)
- Lower quartile: 39 weeks
- Median: 45 weeks
- Upper quartile: 50 weeks
- Maximum: 63 weeks
We want to know how low the 92nd centile wait needs to be, before the ‘eliminate’ target is reasonably achievable. I am going to go for the upper quartile, and express the margin required as a percentage of the ‘eliminate’ target (as opposed to a fixed number of weeks). So, to eliminate 78 week waits, we need 92 per cent of incomplete pathways to be within 50 weeks, which is 36 per cent below the 78 week ‘eliminate’ target.
Now we can convert the ‘eliminate’ targets into 92nd centile targets, using the following table:
| To eliminate waits over | allowing headroom of | the target 92nd centile wait is |
| 78 weeks | 36 per cent | 50 weeks |
| 65 weeks | 36 per cent | 42 weeks |
| 52 weeks | 36 per cent | 33 weeks |
We can use this to assess how difficult the 78 week target was, and how comparatively difficult the next two are going to be.
How difficult? From 104 weeks to 78 weeks
Several months previously, at the end of July 2022, the target to eliminate 104 week waiters was narrowly missed. On that day, how difficult was it to achieve the next milestone, to eliminate 78 week waiters by the end of March 2023? This is the level of difficulty against which the 65 week and 52 week targets will be compared.
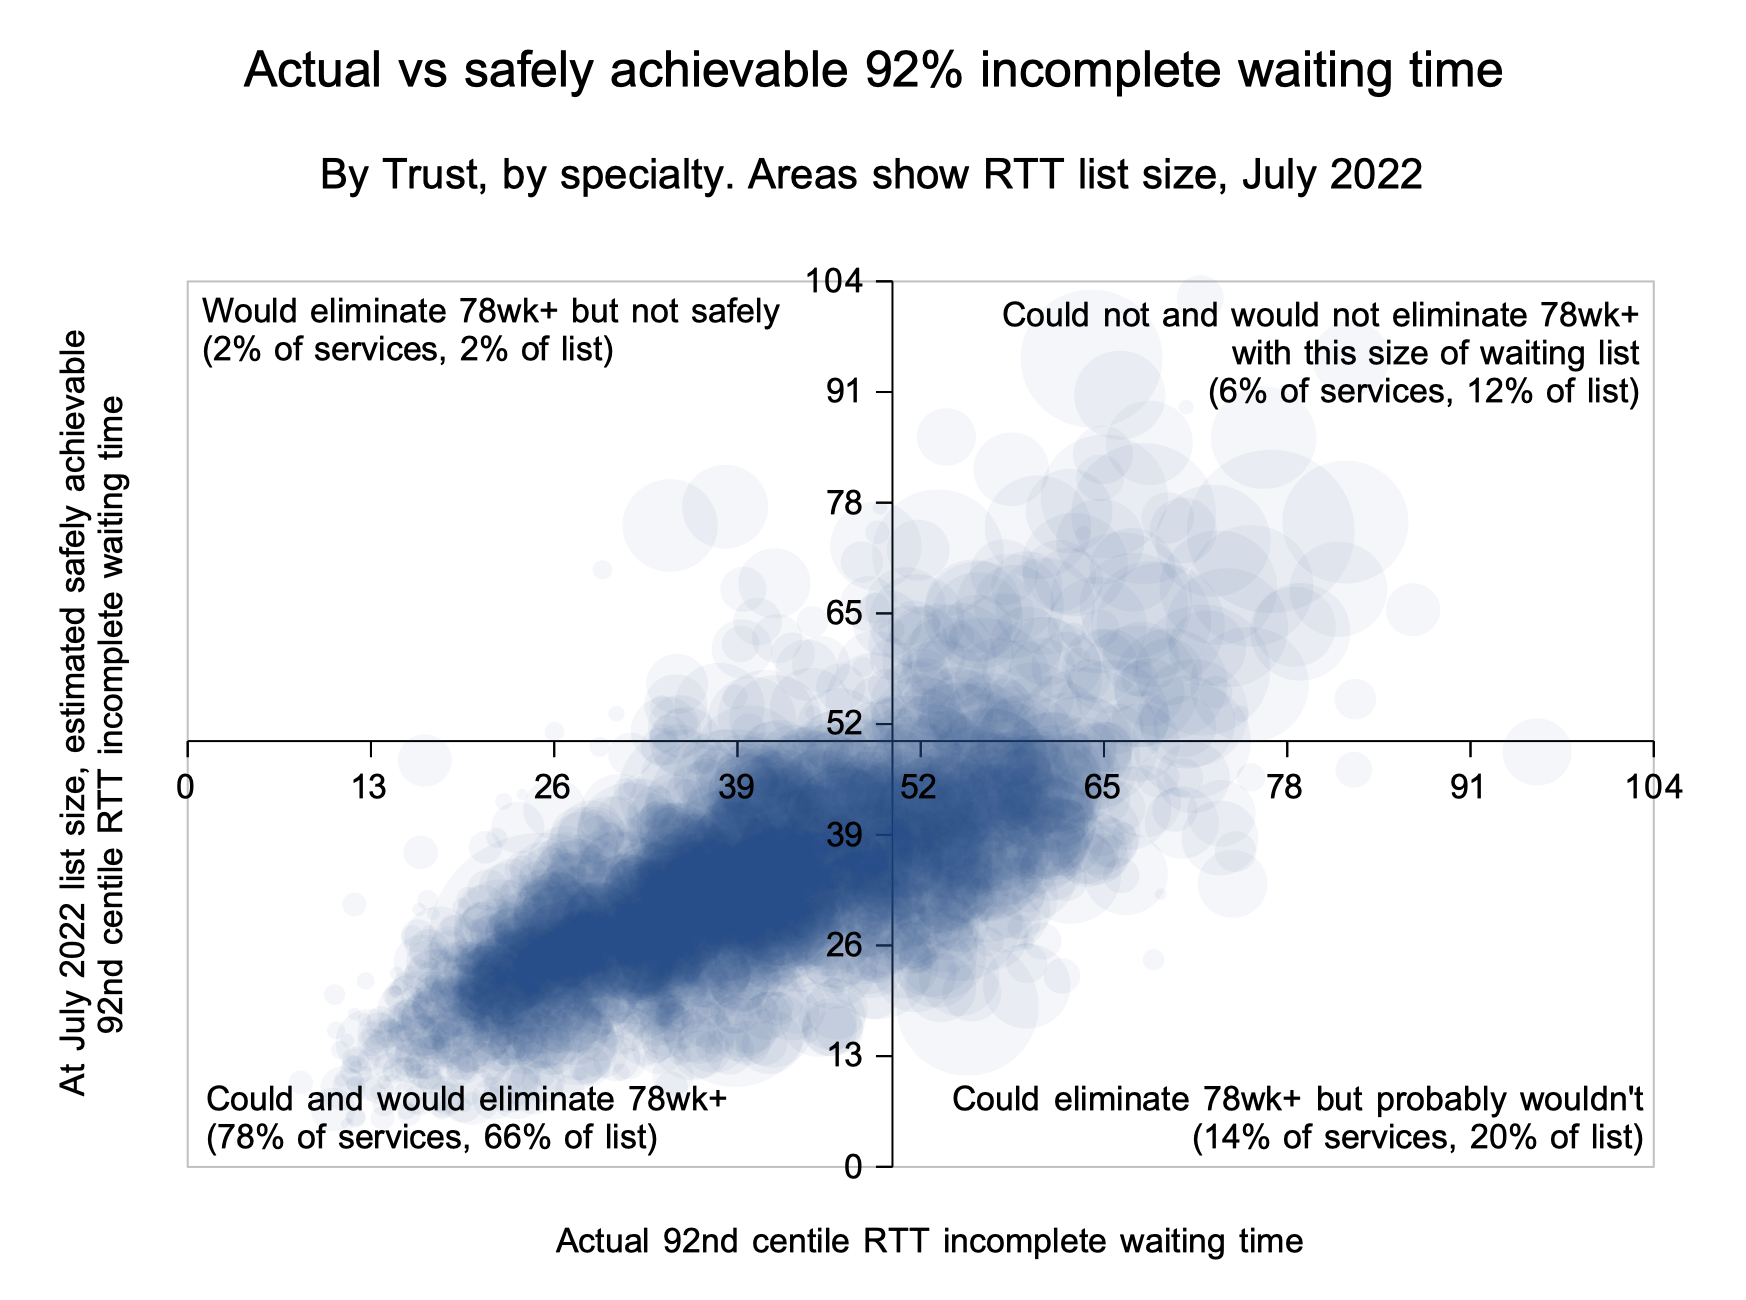
In the chart above, the blue circles show the actual and achievable 92nd centile RTT waiting times across more than 2,000 local services – by specialty, by NHS trust in England. The area of each circle represents the size of each waiting list. Because the chart is plotted by 92nd centile waiting time, we can use the table above to convert those into achievable ‘eliminate’ targets. The axes have been set to cross at 92 per cent within 50 weeks, which corresponds to eliminating 78 week waits.
The bottom left quadrant: could and would eliminate 78wk+
The bottom left quadrant shows the 78 per cent of local services (comprising 66 per cent of the English RTT waiting list) that would be expected to eliminate 78 week waiters safely without needing to reduce the size of their waiting lists. This quadrant represents services where:
- 92 per cent of the waiting list is already within 50 weeks, which according to the table above should be sufficient headroom to eliminate 78 week waiters; and
- modelling shows that the underlying pressures on waiting times are low enough, to allow that target to be achieved safely without distorting clinical priorities.
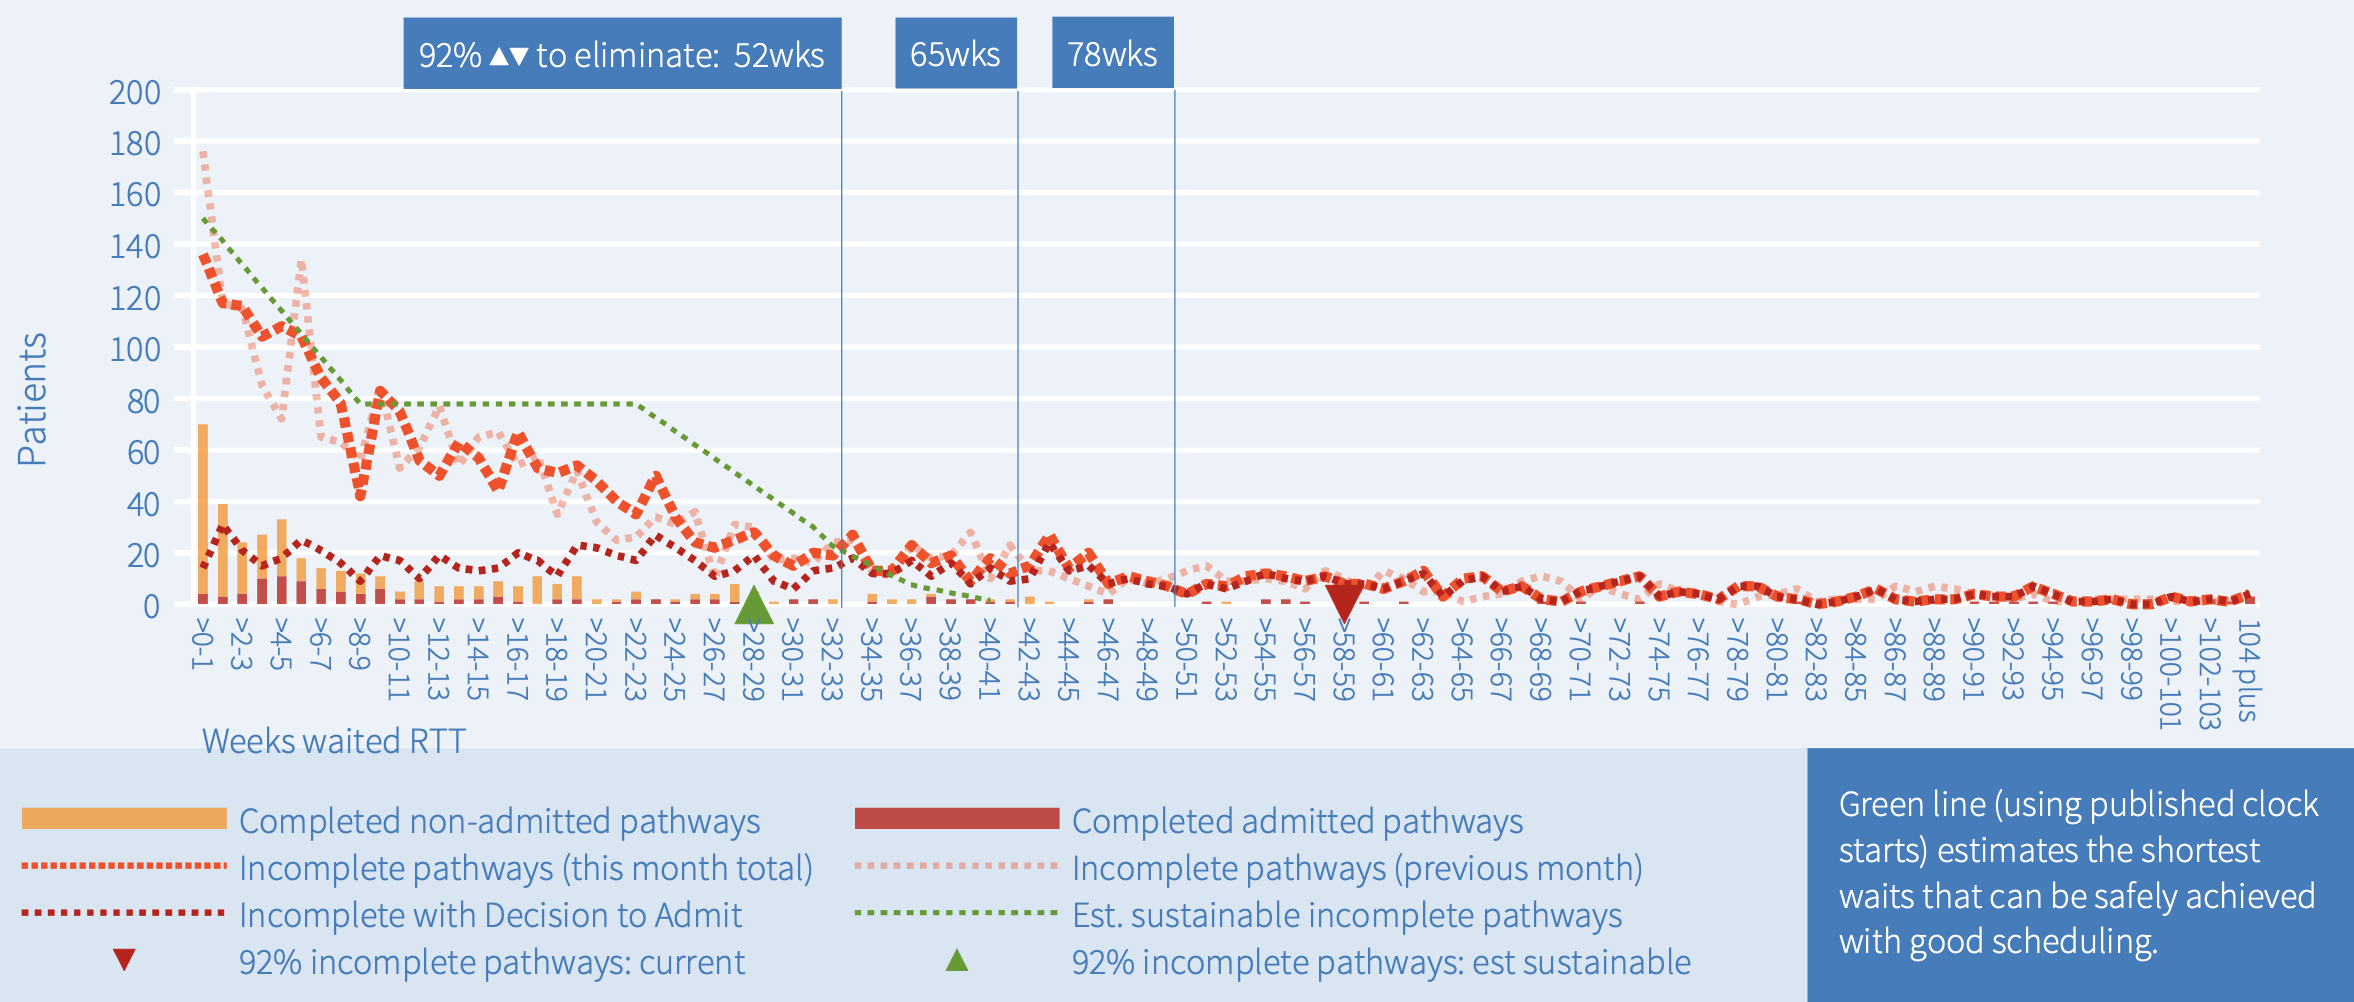
Here is one such service, at the end of July 2022. The red triangle on the horizontal axis shows that the actual 92nd centile waiting time is just below 50 weeks, and the green triangle on top of it shows that the best safely achievable 92nd centile waiting time is also just below 50 weeks. This service is therefore expected to be able to eliminate 78 week waits safely (but narrowly) at the same size of waiting list.
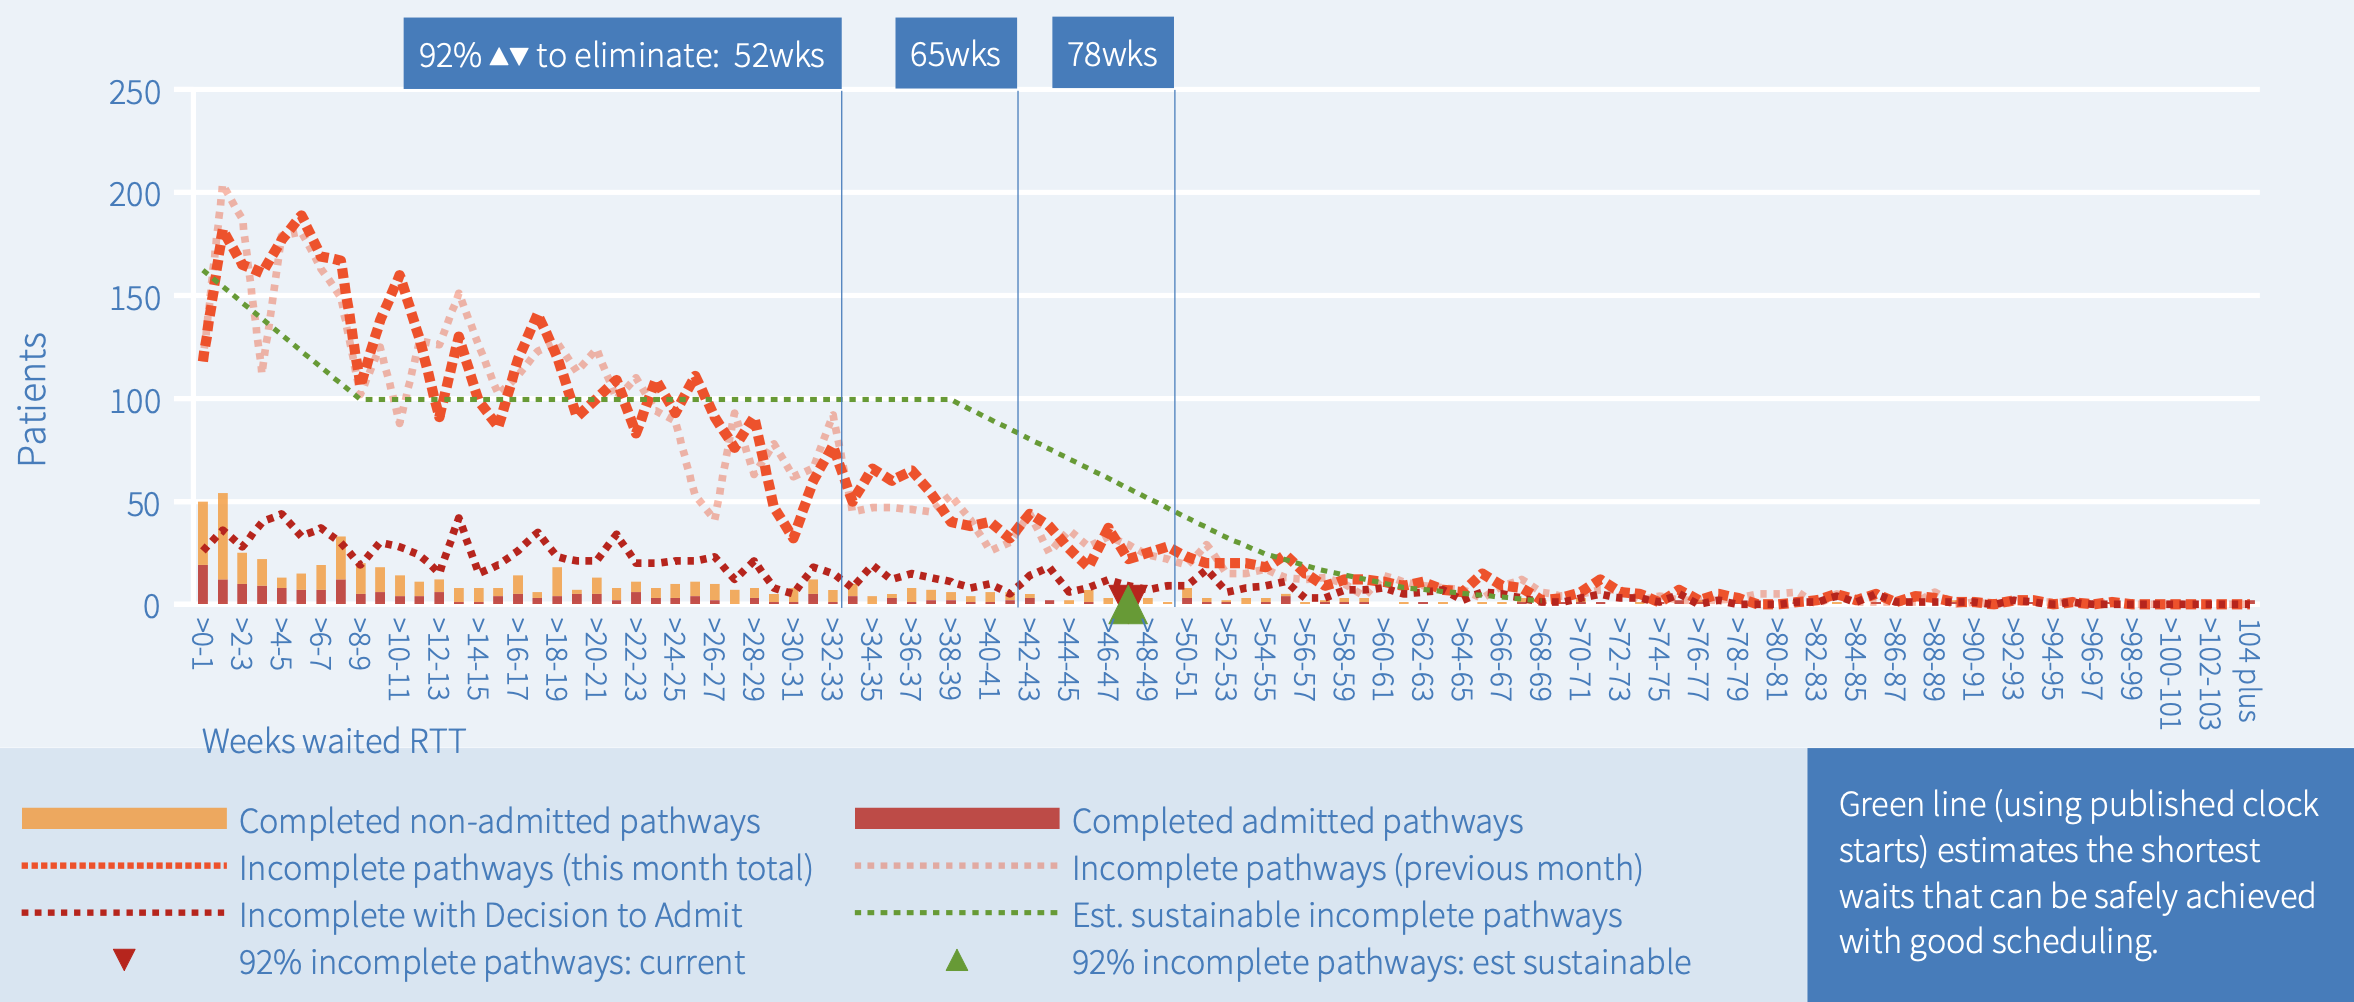
We know how this story ended. As predicted, looking at this service’s March 2023 data, it turns out that it did eliminate 78 week waits successfully, even though the size of its waiting list grew slightly over the period.
The top left quadrant: would eliminate 78wk+ but not safely
The top left quadrant shows the 2 per cent of services that would be expected (on current form) to apply severe operational pressure to achieve the target, even if it were not necessarily safe to do so. These services are achieving 92 per cent within 50 weeks, even though the safely achievable waiting time is much larger. There are thankfully few services in this quadrant, and some of them are only there as a result of data quality problems skewing the modelling.
Here is one such service at the end of July 2022, for which data quality looks reasonable. The red triangle shows that the actual 92nd centile waiting time is well below 50 weeks, and the green triangle shows that the best safely achievable waiting time is more than 60 weeks. Looking at the waiting list itself, which is shown by the dotted orange line, we see that it does not drop off in the short-waiting cohorts, as we might normally expect to allow clinical priority patients to be seen and treated; this is a matter of concern when it comes to the safety of such patients.
Conversely it does drop off very sharply at around 45 weeks which suggests very strict management of the RTT waiting list in date order. Managing routine patients in date order is generally a good thing, but reasonable allowance needs to be made for patient preferences, and the various random events that disrupt orderly scheduling. In this case, such strict date-order scheduling could suggest a lack of flexibility when allowing patients a choice of bookings.
As predicted, looking at this service’s March 2023 data, it turns out that it did eliminate 78 week waits successfully, even though the waiting list shrank only slightly over the period.
The top right quadrant: could not and would not eliminate 78wk+
The top right quadrant shows the 6 per cent of services whose waiting list is so large that it would not be expected to eliminate 78 week waits without reducing the size of the waiting list.
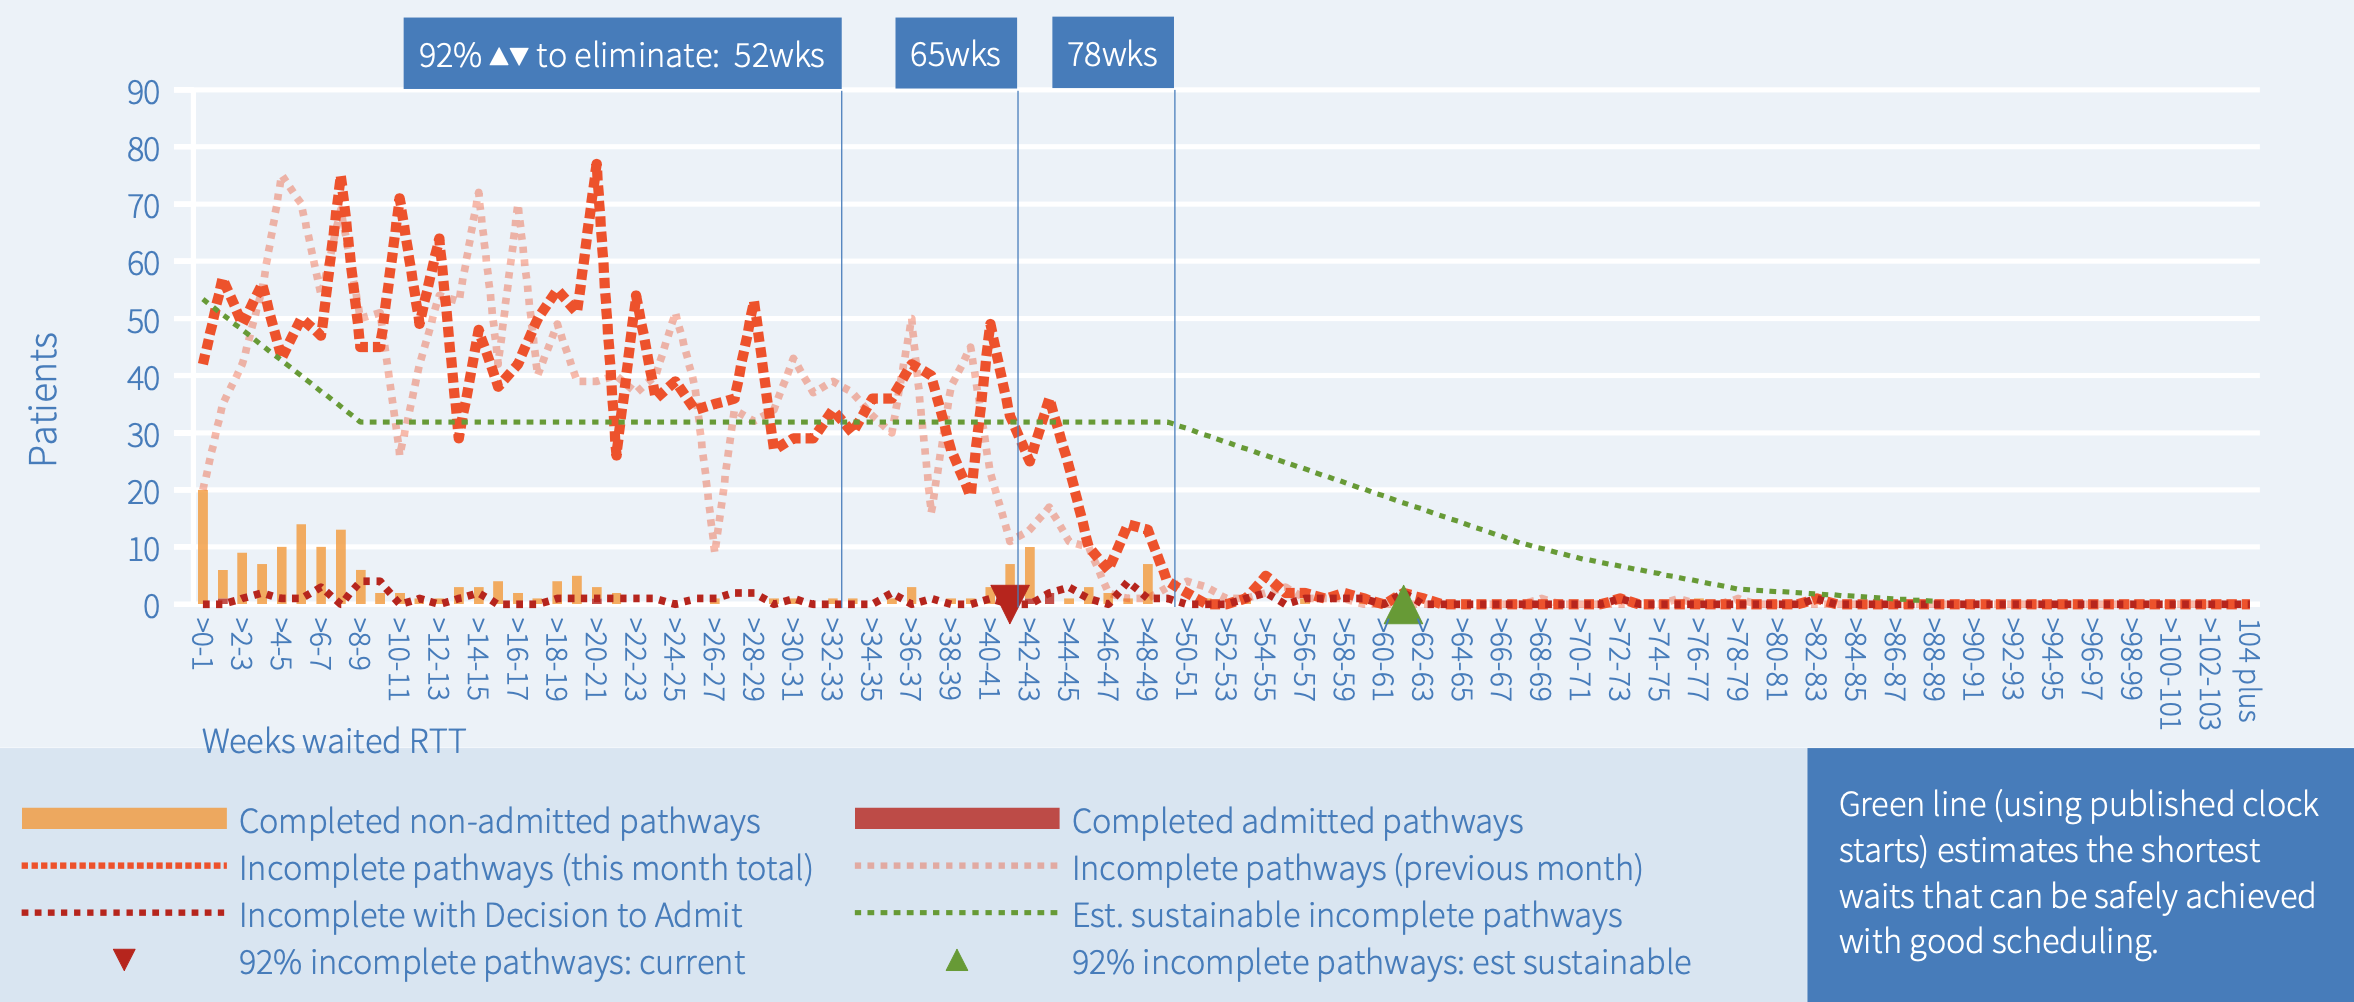
Here is one such service, at the end of July 2022. The red triangle shows that the actual 92nd centile waiting time is more than 50 weeks, and the green triangle shows that the best safely achievable waiting time is also more than 50 weeks. The actual waiting list (dotted orange line) matches the estimated safely achievable waiting list (dotted green line) reasonably well, suggesting the list is being well and safely managed – the long waiting times are caused by the huge list size which is not the fault of the booking and scheduling staff.
As predicted, looking at this service’s March 2023 data, it failed to eliminate 78 week waiters, with nearly two dozen 78 week breaches remaining on the waiting list.
The bottom right quadrant: could eliminate 78wk+ but probably won’t
The bottom right quadrant shows the 14 per cent of services whose waiting list is probably small enough to eliminate 78 week waits safely, but they are still expected to fail because they are not booking their patients according to clinical priority and date on list, so their waiting times are longer than they could be. There are many reasons why this might be, from poor adaptation to the shortcomings of eReferrals Service, to subspecialisation, to poor pathway data and management.
Here is one such service, at the end of July 2022. The red triangle shows that the actual 92nd centile waiting time is more than 50 weeks, while the green triangle suggests that a wait of below 30 weeks should be achievable with good patient scheduling and good resource allocation within the specialty. The dotted orange line shows that small numbers of patients were waiting all the way out to 104 weeks plus even though such waits should have been eliminated by this target deadline date.
As predicted, looking at this service’s March 2023 data, it failed to eliminate 78 week waiters, with more than two dozen 78 week breaches remaining on the waiting list, and the longest waiter reported at 101 weeks.
Source of these analyses
The above examples come from the RTT waiting times analyses that I publish every month. You can access them free of charge from this map or this web page. The methods used to calculate the green line and green triangle are those developed for Gooroo Planner, applied in this case to the published RTT data but usually used locally for stage-of-treatment waits for capacity planning.
I chose examples above that illustrate each quadrant well, and where the story turned out as expected. Admittedly, not all examples are that good. In some cases, the trust’s reported RTT data is very poor quality and then the analysis is not reliable. In other cases, the trust managed to eliminate 78 week waiters against the odds, or failed when it could have achieved, or saw significant change in the size of the waiting list. Nevertheless, I didn’t have to look hard for these examples and the analyses mostly served well.
Having established how difficult it was to go from 104 weeks to 78 weeks, let’s look at the next two targets and see how they compare.
How difficult? From 78 weeks to 65 weeks and 52 weeks
On the last day of March 2023, which at the time of writing is the more recent available data, the target to eliminate 78 week waiters was missed at national level. How difficult will it be to eliminate 65 week waits by the end of March 2024, and then 52 week waits by the end of March 2025?
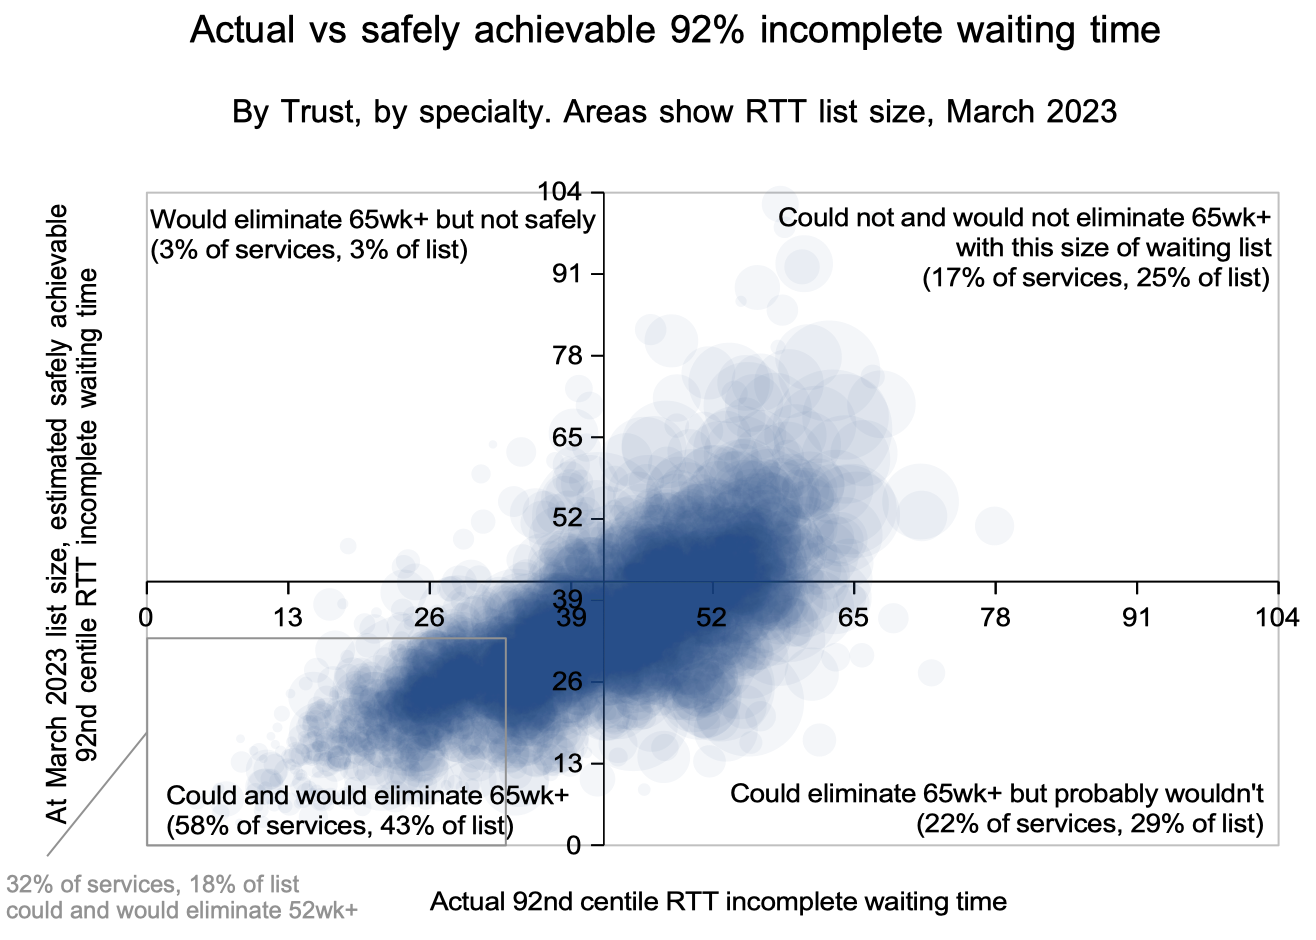
In the chart above, we can see why the next two targets will be far more difficult, because far fewer services are in the bottom left quadrant:
- Firstly, recall that in July 2022, the analysis suggested that 78 per cent of local services could and would eliminate 78 week waiters without needing to reduce the size of their waiting lists.
- The axes cross at 92 per cent within 42 weeks, which corresponds to the target to eliminate 65 week waits, and only 58 per cent of services could and would achieve this.
- A grey box outlines those services that have 92 per cent within 33 weeks, which corresponds to eliminating 52 week waits, and only 32 per cent of services could and would achieve this.
If hospitals try to eliminate 65 week and 52 week waiters just by targeting cohorts of long-waiting patients in the usual way, they will find that they cannot see and treat those patients quickly enough because the available capacity leading up to the target deadline has already been filled.
So a better approach is needed, which addresses the root causes of long waiting times with reliable and continuous processes. That includes reducing each waiting list to a sustainable size with well-targeted activity and capacity that exceeds demand by the right amount, as well as other pathway management processes such as knowing what every patient needs next, booking patients in the right order, keeping patients involved during their wait, having accurate data, streaming patients to the right pathways, and ensuring that all activity helps to progress patients efficiently towards their diagnosis and treatment.
Targeting cohorts of long-waiters is not the only tool used by the NHS to reduce waiting times, and the backlog recovery plan includes ambitious targets to increase activity to 30 per cent above pre-pandemic levels. But success on this measure has so far been mixed, as have efforts to free outpatient capacity by reducing follow-ups. And to be effective, the extra activity and capacity would need to be more accurately targeted on the right local services.
In short, the NHS will need to change the way it approaches these targets. If it doesn’t, then we are heading for a conspicuous failure on the 65 week target in the run-up to the next general election.