

The wait for diagnosis and decision is rising much faster than the wait for treatment.
Analysis produced for Health Service Journal by Dr Rob Findlay, Director of Strategic Solutions at Insource Ltd and founder of Gooroo Ltd
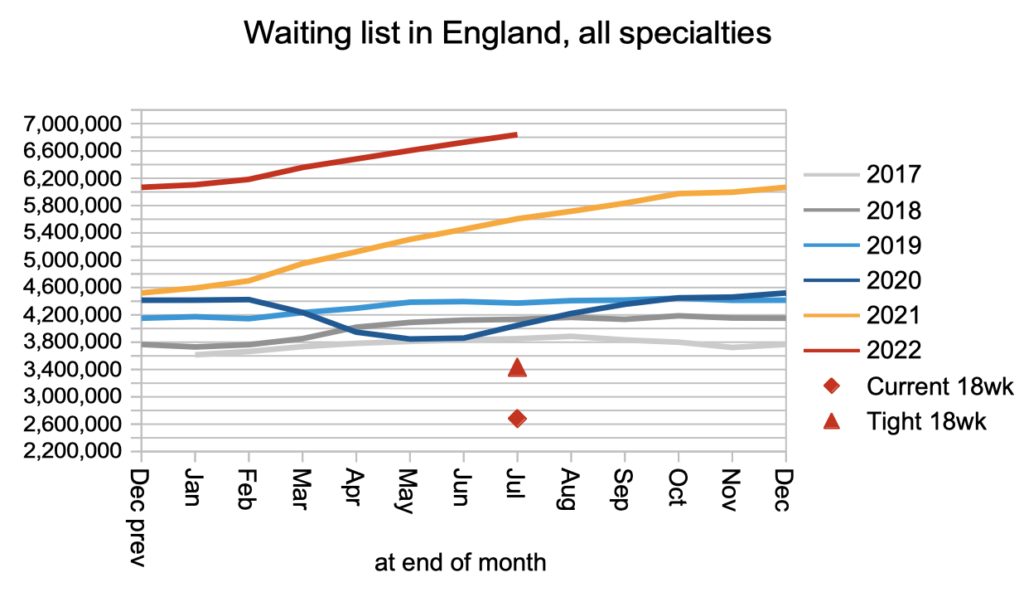
The English waiting list reached 6,935,640 patient pathways at the end of July, including estimates for non-reporting trusts. So, it has almost certainly passed the 7 million mark during August, as next month’s figures will show.
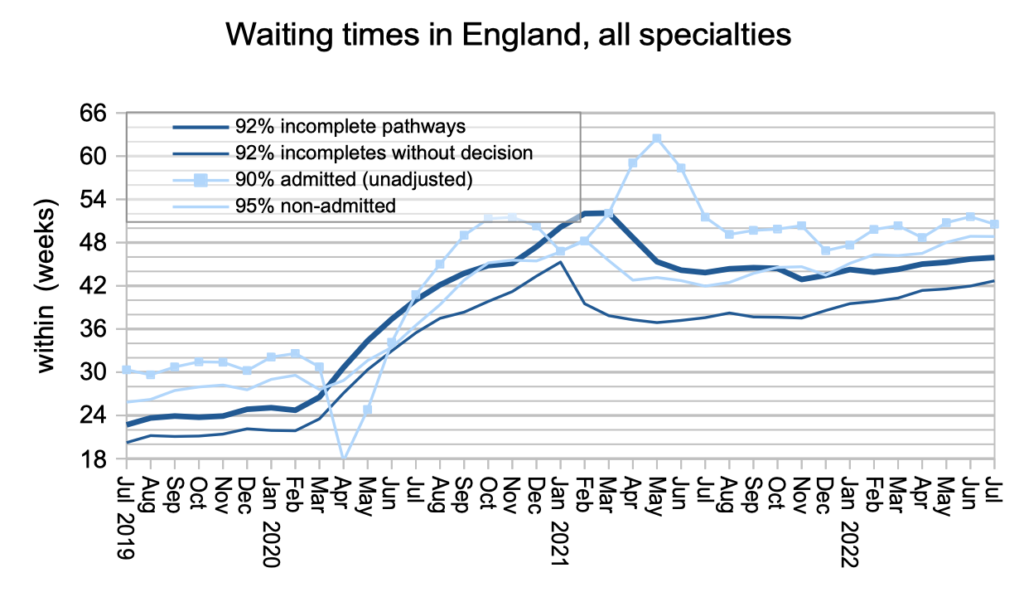
But to a patient on the waiting list, it doesn’t really matter how many others are in the same predicament. It is the waiting time that counts. So in amongst the gloomy statistics, it is particularly concerning that the wait for diagnosis and decision rose from 42.0 to 42.7 weeks during July, which is far too long if the diagnosis turns out to be an unsuspected cancer or other urgent condition.
At the moment, hospitals are not being required to reduce the wait for diagnosis and decision. Instead the focus is turning to patients who are waiting longer than 78 weeks for treatment, half of whom already have a diagnosis and decision to admit (compared with just 16 per cent of the waiting list as a whole).
Perhaps as a result, waiting times from referral to diagnosis and decision (for which there is no target) are rising much faster than the overall wait from referral to treatment (for which there is a target). Since November 2021, the wait for diagnosis and decision has risen by more than 5 weeks, compared with 3 weeks for referral to treatment (RTT) waits.
When blunt targets are pursued directly, there is always a risk of other things going out of balance. If those things include clinical priorities, undiagnosed patients, and high cost per case services, then significant risk starts to build up. At some point those risks will come to the surface.
In the following discussion, all figures come from NHS England. If you have a national statistic that you’d like to check up on, you can download our waiting times fact checker.
The numbers
The trends that follow will be familiar to anyone who has been following these statistics in recent months.
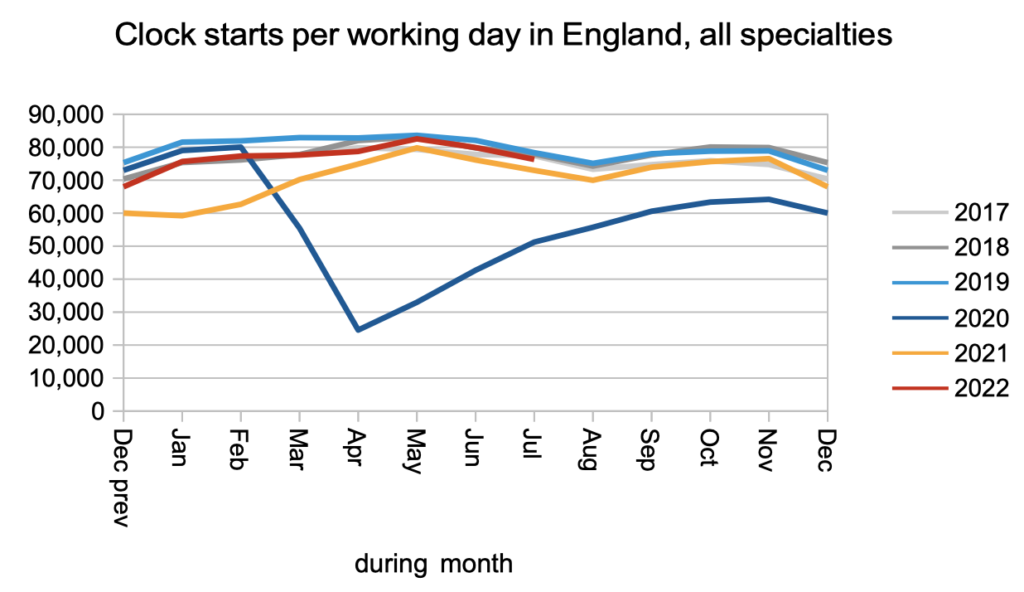
Demand (in the form of new waiting time ‘clocks’ starting because a patient has been referred for elective care) continues at pre-pandemic levels, with no sign of any surge caused by pent-up demand from the pandemic.
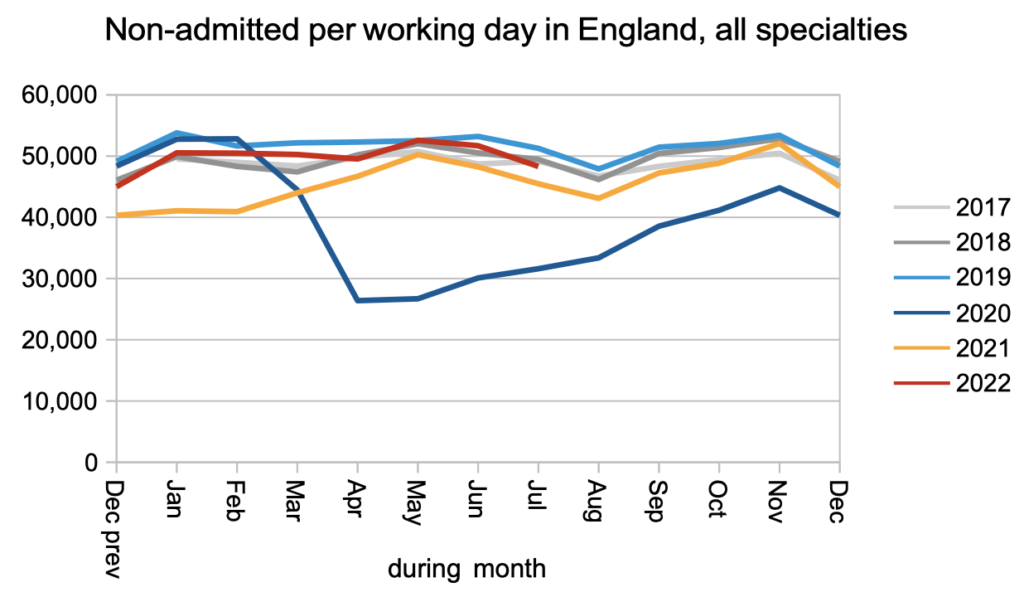
The number of patients who leave the waiting list for any reason other than being admitted for treatment (for example, those discharged from outpatients) is running slightly below pre-pandemic levels.
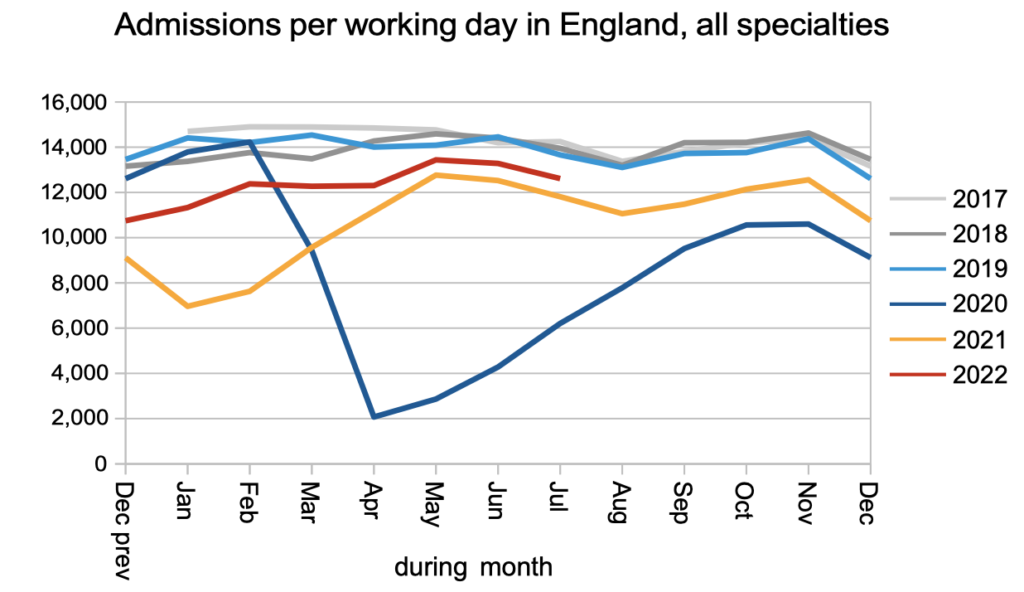
The number of patients who leave the waiting list because they have been admitted to hospital for inpatient or daycase treatment is running significantly below pre-pandemic levels.
The net result of patients being added to the waiting list at pre-pandemic levels, and leaving it at lower than pre-pandemic levels – and remembering that the waiting list was growing before the pandemic – is a rapidly growing waiting list.
A rapidly growing waiting list means the underlying pressures on waiting times are also growing rapidly. The next chart shows that RTT waits are continuing to rise, and the wait to diagnosis and decision is rising even faster.
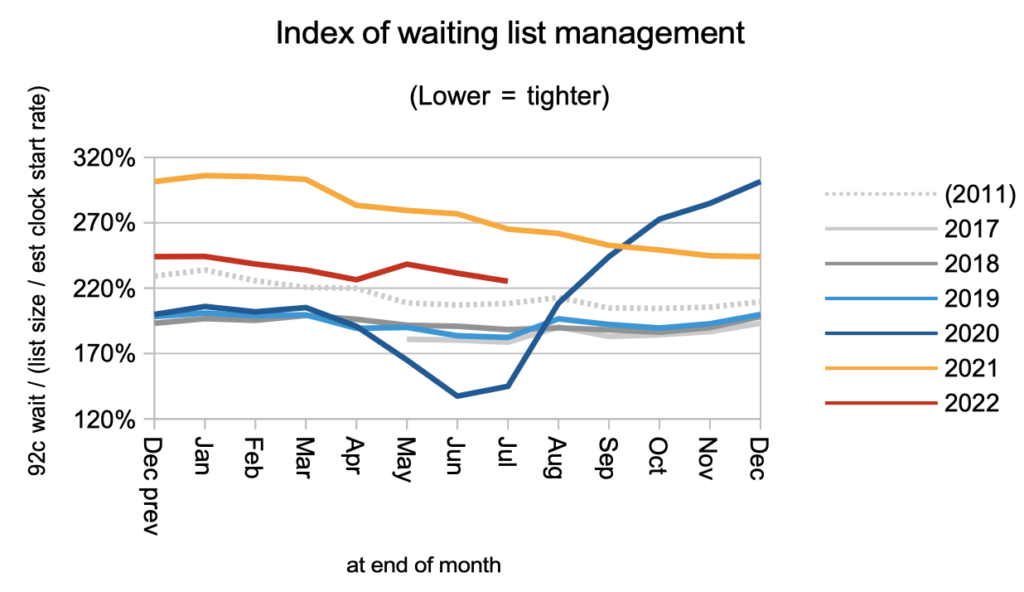
Waiting times are a function of both the size and shape of the waiting list, and the chart below is an indicator of the shape. It is still much worse than pre-pandemic.
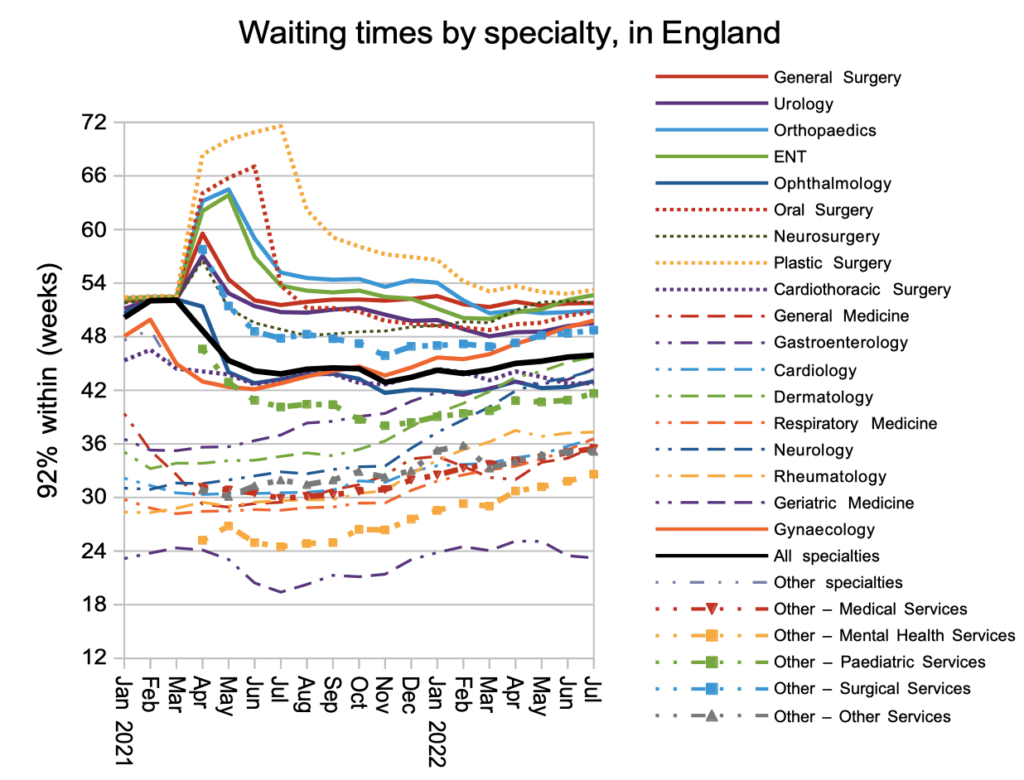
At specialty level, the rapid rise in Gynaecology and ENT waiting times is a particular cause for concern.
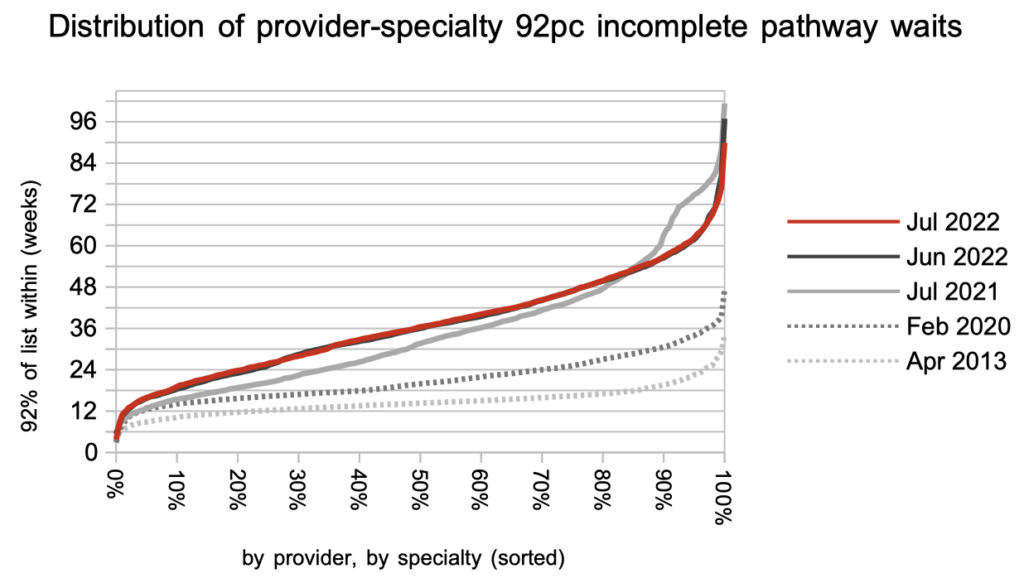
The distribution of local waiting times around the country changed little during July. Waiting times remain much higher and more varied than pre-pandemic. The higher variation is a major driver of the poor waiting list shape noted above.
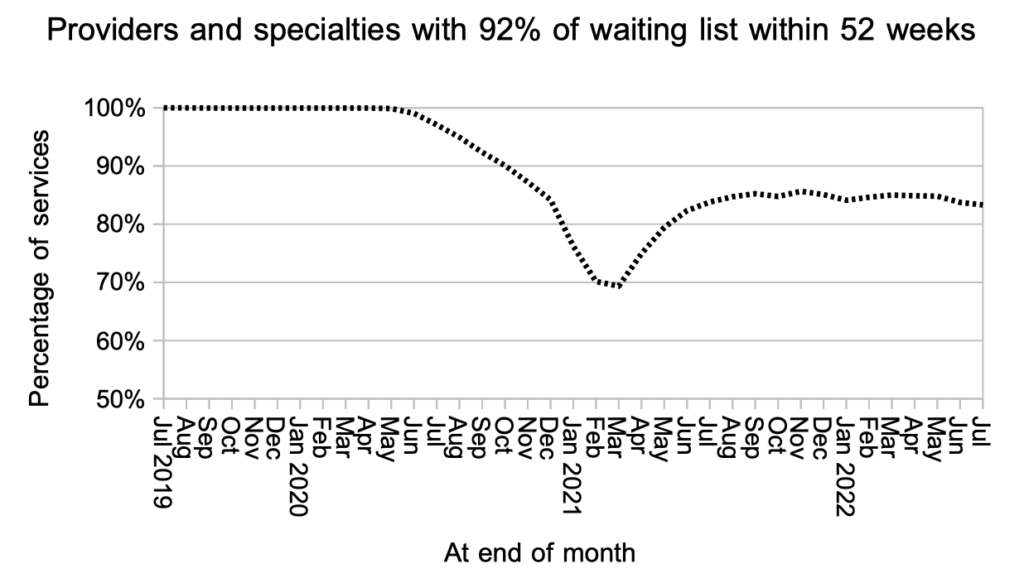
I usually focus on how long patients are waiting, as opposed to how many are exceeding some arbitrary threshold, mainly because the latter approach is not informative when the arbitrary threshold is very different from the experience of most patients. But I think it is worth noting the slippage on 52-week RTT waiting times.
The statutory target is that 92 per cent of the RTT waiting list should be within 18 weeks, and the chart below shows that the proportion of local hospital services achieving 52 weeks on that measure is declining again, even as the NHS focuses on eliminating the longest waits. As the underlying pressure on waiting times grows, more and more local services will find that eliminating 78 week waits cannot be achieved safely.
Referral-to-treatment data up to the end of August is due out at 9:30am on Thursday 13th October.