

It will be difficult to stop the waiting list from growing. But once that is achieved, restoring 18 weeks in one term is not a lot different to doing it in two.
Analysis produced for Health Service Journal by Dr Rob Findlay, Director of Strategic Solutions at Insource Ltd and founder of Gooroo Ltd
Goal one – the next Labour government will deliver an NHS that is there when you need it:
… waiting lists – down; planned treatment within 18 weeks.
No backsliding, no excuses – we will meet these standards again.
Keir Starmer, leader of the Labour Party, Monday 22 May 2023
It’s ambitious. But is it too ambitious?
Even before the pandemic the task looked daunting. Mid-pandemic it was worse, and I reckoned it would take two parliamentary terms (8 years or so) to get back to 18 weeks. Now that the pandemic emergency has passed, waiting lists are worse again. So restoring 18 weeks in a single term must be pie in the sky. Right?
Actually no. I think Labour have got their sums right, and restoring 18 weeks in a single parliamentary term would not be much more difficult than spreading it over two. Why?
Because one big thing has changed since mid-pandemic: the expected ‘surge’ of pent-up demand, caused by millions of elective patients coming rushing back after staying away from their GPs during the pandemic, has not materialised. At this point, we can probably assume that it never will.
That reduces the task of recovering 18 week waits to the usual two components: closing the recurring gap between activity and demand; and a one-off effort to clear the backlog. Now that the risk of a ‘surge’ has receded, the recurring gap is the more prominent. And that is why it makes less difference whether the backlog clearance is spread across one term or two.
The recurring gap last financial year was about 5.8 per cent of activity. Any further trend growth in demand would need to be added to that, but we’ll neglect that in this analysis (and it would strengthen the case anyway). This recurring gap can be closed by any combination of increased activity or reduced demand, but either way it must be closed, every year, to stop things getting worse – a political bare minimum, if you like.
Once we are keeping up with demand, we can turn our attention to the eye-catching bit: the one-off waiting list reduction needed to make 18 weeks achievable again. The reduction is around 3.9 million patient pathways, assuming it is well targeted at the right specialties and trusts. That is 2.8 per cent above demand if spread across two parliamentary terms, or 5.6 per cent if compressed into one.
We are now ready to bring those two components together. Combining the recurring intervention needed to keep up with demand, and the one-off intervention needed to reduce the waiting list and make 18 weeks achievable again, we reach a total intervention of 8.7 per cent over two parliamentary terms or 11.7 per cent over one. In either case, when we are finished, we can drop back to 5.8 per cent above current activity (plus enough to compensate for further growth in demand) to stop the list from growing back again.
Now we have all the numbers we need to make the judgement.
The argument is that if the NHS can deliver an intervention of 8.7 per cent above recent activity for two parliamentary terms, which is a lot, then it could probably deliver 11.7 per cent for one term and so deliver 18 weeks more dramatically in a single parliament. It’s a bigger intervention, but not massively bigger, and for a shorter time. And if even 8.7 per cent sounds too daunting, remember that 5.8 per cent must be achieved every year under any scenario – the political bare minimum.
All in all, it looks reasonable on these numbers to recover 18 weeks in a single parliamentary term. And all thanks to the mysterious non-resurgence of pent-up demand from the covid period.
The numbers
There are of course some caveats in the above analysis.
If the waiting list inherited by the next government is bigger (or smaller), then so will be the task of getting it down to the required size.
The size we are aiming at assumes a good waiting list shape, which would only be achieved if the additional recurring and non-recurring resources were targeted reasonably accurately at those local services that need them most, to even out the pressures in waiting times; in some specialties where there are national capacity constraints that may not be possible. If resources were allocated inaccurately (for instance as a result of unwisely setting list size targets) then a bigger reduction in list size would be needed (quantified below), which would increase the non-recurring intervention or extend the time frame to allow things to settle out.
Here is the detailed version of the calculations.
In the following analysis, all numbers come from the “RTT Overview Timeseries Including Estimates for Missing Trusts Mar23 (XLS, 94K)” file on the NHS England RTT statistics pages. I did the full analysis properly using Gooroo Planner but the following simplified summary tells the same story.
This analysis is done on an RTT basis, so additions to the waiting list are represented by clock starts, activity by admitted and non-admitted clock stops (even though the latter do not count all activity), and the waiting list by incomplete pathways. It is also possible to contruct this kind of analysis based on outpatient and admitted patient activity instead (which is based on real activity, and which trusts have to do locally for operational capacity planning), but that breaks the direct correspondence with the RTT waiting time targets. So for this policy discussion, which does not involve capacity, I have kept things simple and used an RTT basis.
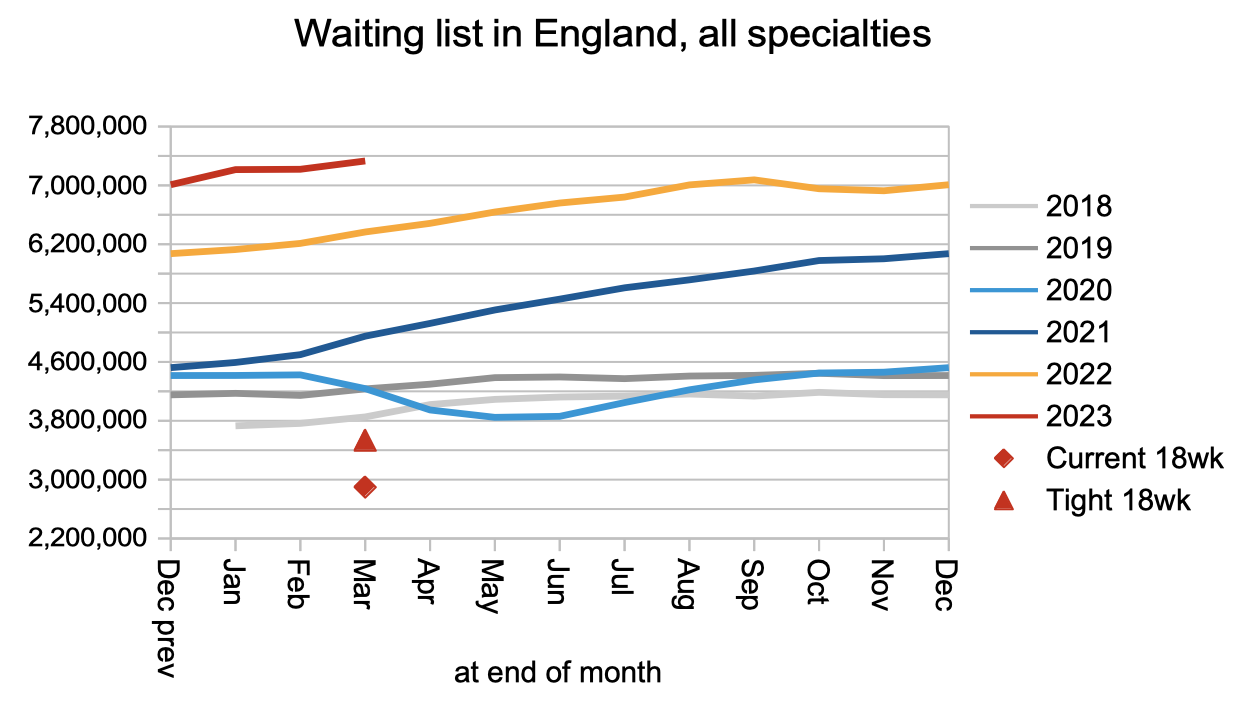
Taking financial year 2022-23 as the baseline, we have 16,488,366 clock stops as our proxy for activity, and a final waiting list of 7,331,974 incomplete pathways which is 966,202 bigger than at the start of the financial year. So RTT demand was roughly RTT activity plus growth in RTT waiting list, which comes to 17.5 million, or just over 5.8 per cent larger than the RTT activity figure. That is where the recurring gap of 5.8 per cent came from above – it is how much RTT activity would need to increase (and/or demand reduce) to stop the waiting list from growing.
Turning to the non-recurring effort, the waiting list we need to achieve is calculated using the method given in my monthly RTT waiting time reports; based on the end of March position, it corresponds most closely to the red triangle in the chart below. It represents the size of waiting list that would be consistent with restoring 18 weeks, if the shape of waiting list also went back to where it was around the time when 18 weeks was last being achieved. (If the shape did not improve then we would need to reduce the list size further to around the red diamond.)
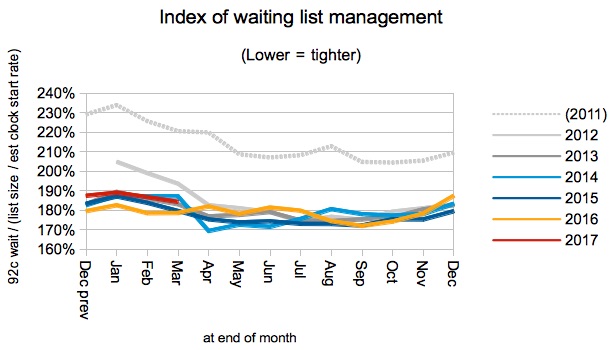
A bit more about how that red triangle was calculated. The chart below shows the best waiting list shapes achieved historically, in the years following the announcement of the incomplete pathways target in late 2011, and before the shape really started to deteriorate later on in the summer of 2017. As the chart below shows, the shape of list varies seasonally, so in the present analysis I have used the most challenging (i.e. highest) average value of 187 per cent, to estimate the size of list that should make 18 weeks achievable year-round.
Plugging that into the formula shown beside the y-axis, we need to reduce the RTT waiting list to a total of 3,448,450 incomplete patient pathways, which is slightly less than half the current list size.
The next step is to estimate the starting point – the waiting list size that the next government will inherit. Will the list continue growing between now and the next general election? Or will the “clear plan, aimed at delivering around 30% more elective activity by 2024/25 than before the pandemic” be successful at bringing the waiting list down? I don’t know, and nor does anyone else. So I am assuming it stays the same size as it is now.
Reducing the end of March list size (7,331,974 pathways) to the sustainable 18-week size (3,448,450 pathways) is equivalent to a non-recurring activity increase (and/or demand reduction) of 3,883,524. This is 5.6 per cent of four years of demand, or 2.8 per cent of eight years of demand, both of which are figures used above for one parliamentary term and two terms. (I am assuming four years per parliamentary term – close to the median interval between UK general elections over the past century which is 4.1 years.)
To combine the recurring and non-recurring increases, we multiply them. Using the ‘one parliamentary term’ numbers as an illustration: if we want to combine a 5.8 per cent recurring increase to match demand, with a 5.6 per cent non-recurring increase over demand to reduce the waiting list, then the sum is 1.058 * 1.056 = 1.117 which is an increase of 11.7 per cent.